Market Overview: Bitcoin Futures
Bitcoin futures ii after bear breakout and still trading around a major price level, which is the 2017 close. Traders consider that the current area is a sweet spot for trading. Next week is the monthly bar close; so far, November is a bear bar with a prominent tail on both ends, at the bottom of a nested wedge and testing 2019 high breakout point.
Bitcoin futures
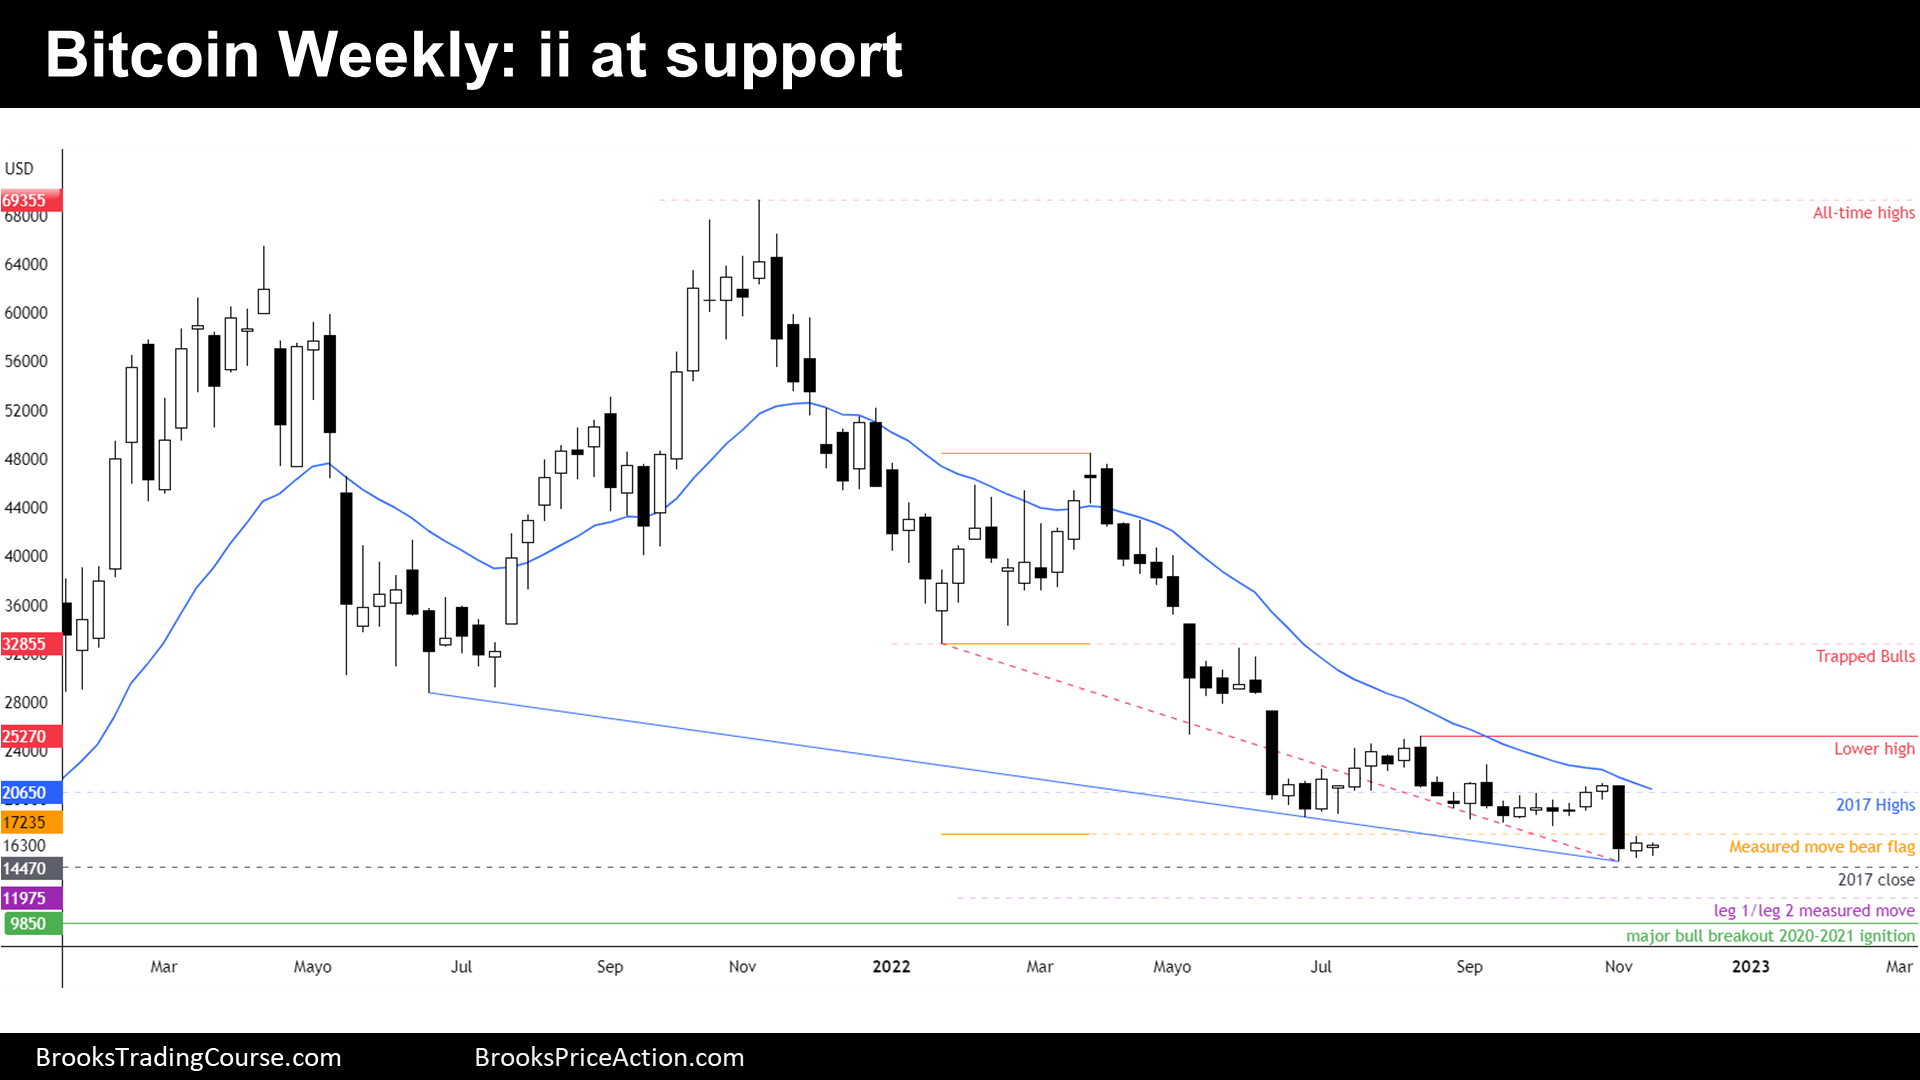
The Weekly chart of Bitcoin futures

- This week’s candlestick is a bull doji. It is an inside bar following an inside bar; hence, it is an ii, buy and sell setup. The setup looks better for the bulls because the price sits at support and because the ii is formed by two bull bars that are following a bear breakout; it will be viewed as bears failing.
- During past reports, we have said that the current area it is critical. There is the 2017 close at $14470, the breakout point from 6/26/2019 highs at $14170 and the $15000 big round number.
- Traders think that this is the place where the future will be determined.
- A bull reversal from here will be considered as a bottom and a continuation of the long term bull trend.
- A bear breakout until around $10000 will be considered as the end of the long term bull trend.
- What is more likely? Nowadays, the continuation of the bull trend. I think this way because during the 2020-2021 bull breakout, bitcoin topped at 04/14/2021 high. Then Bitcoin retraced 2/3 of the whole trend, but ended achieving fresh all-time highs followed. This is key because that strongly motivated traders to buy below $28800, the 06/22/2021 low.
- During the bear trend that followed the all-time highs, there are strong bear legs, but we can also draw several wedge bottom patterns. This behavior normally indicates that the bear channel is just a bear leg in what will become a trading range.
- As stated during the past report, math is good for the bulls. Bears in a trade still have targets to reach, but those willing to sell, will have better odds if they wait to sell higher.
- We might see lower prices this year because $14470 is a strong magnet, but we should expect a bull reversal happening within the current price area.
- If the price trades above the current week high, the price may have a strong bullish reaction
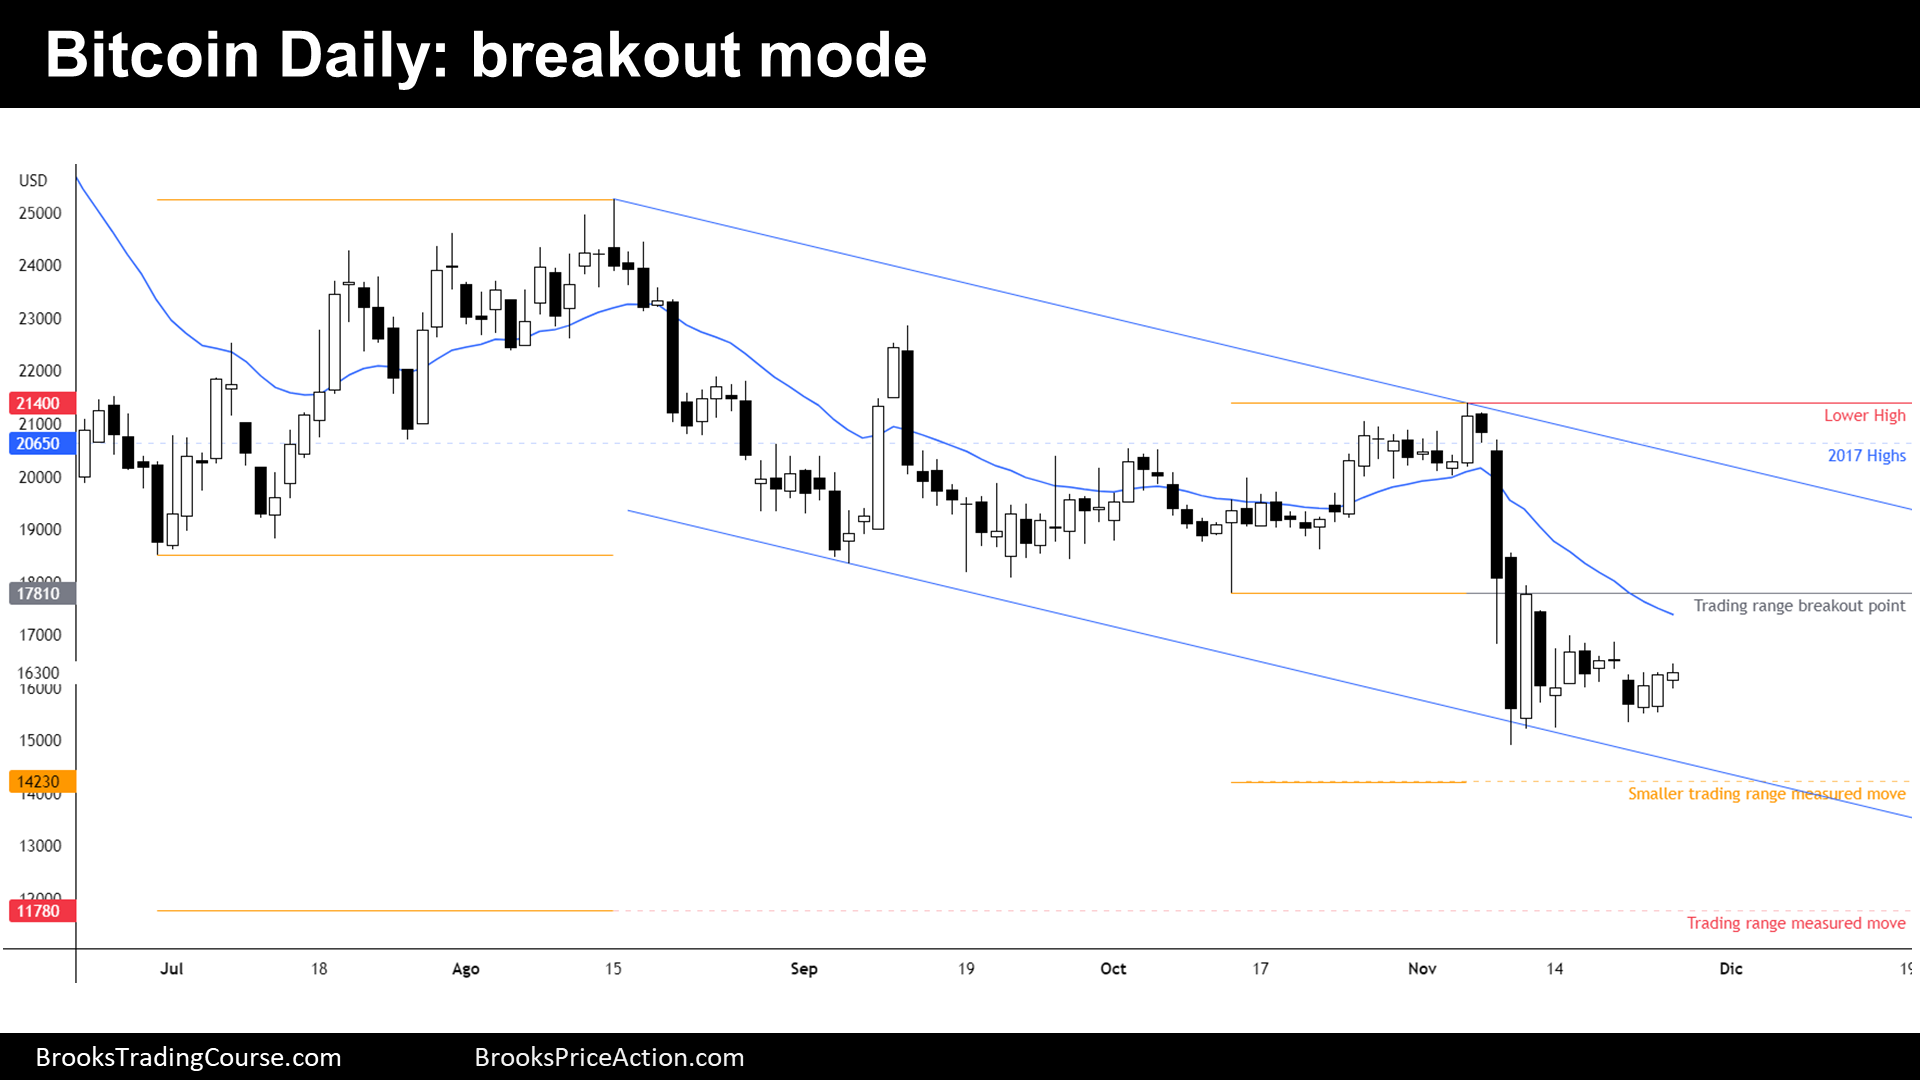
The Daily chart of Bitcoin futures

- Last week we have said that the context favored limit order trading, which on a chart is represented by trading sideways, which is what happened.
- Bulls think that the price is creating a double bottom, while bears believe that the price is forming a bear flag to continue the bear trend.
- Bears did not reach their primary target, which is at $14230.
- During prior reports, we have said that the context is more likely a broad bear channel than a strong bear trend because bulls were making money buying below lows and scaling in lower.
- 70% of the time, a broad bear channel is just a bear leg in what will become a trading range. There is a 70% chance that bulls buying below new lows and scaling in will make money. Bulls have good math here and below new lows.
- Bears, in theory, can also sell new lows and make money during bear channels.
- But this theory should be placed in the context that the price is at a major support area, a fact that should be deeply considered by traders willing to trade in either direction.
- Last week, we have said that swing traders will wait to enter the market until they see consecutive bull or bear bars. Past three bars were bull bars, but all of them gapped down on the open and barely closed above the prior bars.
- Buying here with a wide stop looks like a good idea, but today it doesn’t look like the limit order trading has stopped. Swing traders want to see a big breakout but even better, a breakout with good follow through, before acting.
- Wednesday is the last trading day of the month, the October low at $17810 might act as a magnet.
Market analysis reports archive
You can access all weekend reports on the Market Analysis page.

