Market Overview: Bitcoin Futures
During the week, the Bitcoin futures traded above last week’s high and then reversed down, closing the week far below last week’s lows. The price is now headed to the lows of the year. Despite a Bitcoin bear trend resumption attempt, bulls and bears have reasonable arguments to sustain their respective thesis, a sign of trading range price action.
Bitcoin futures
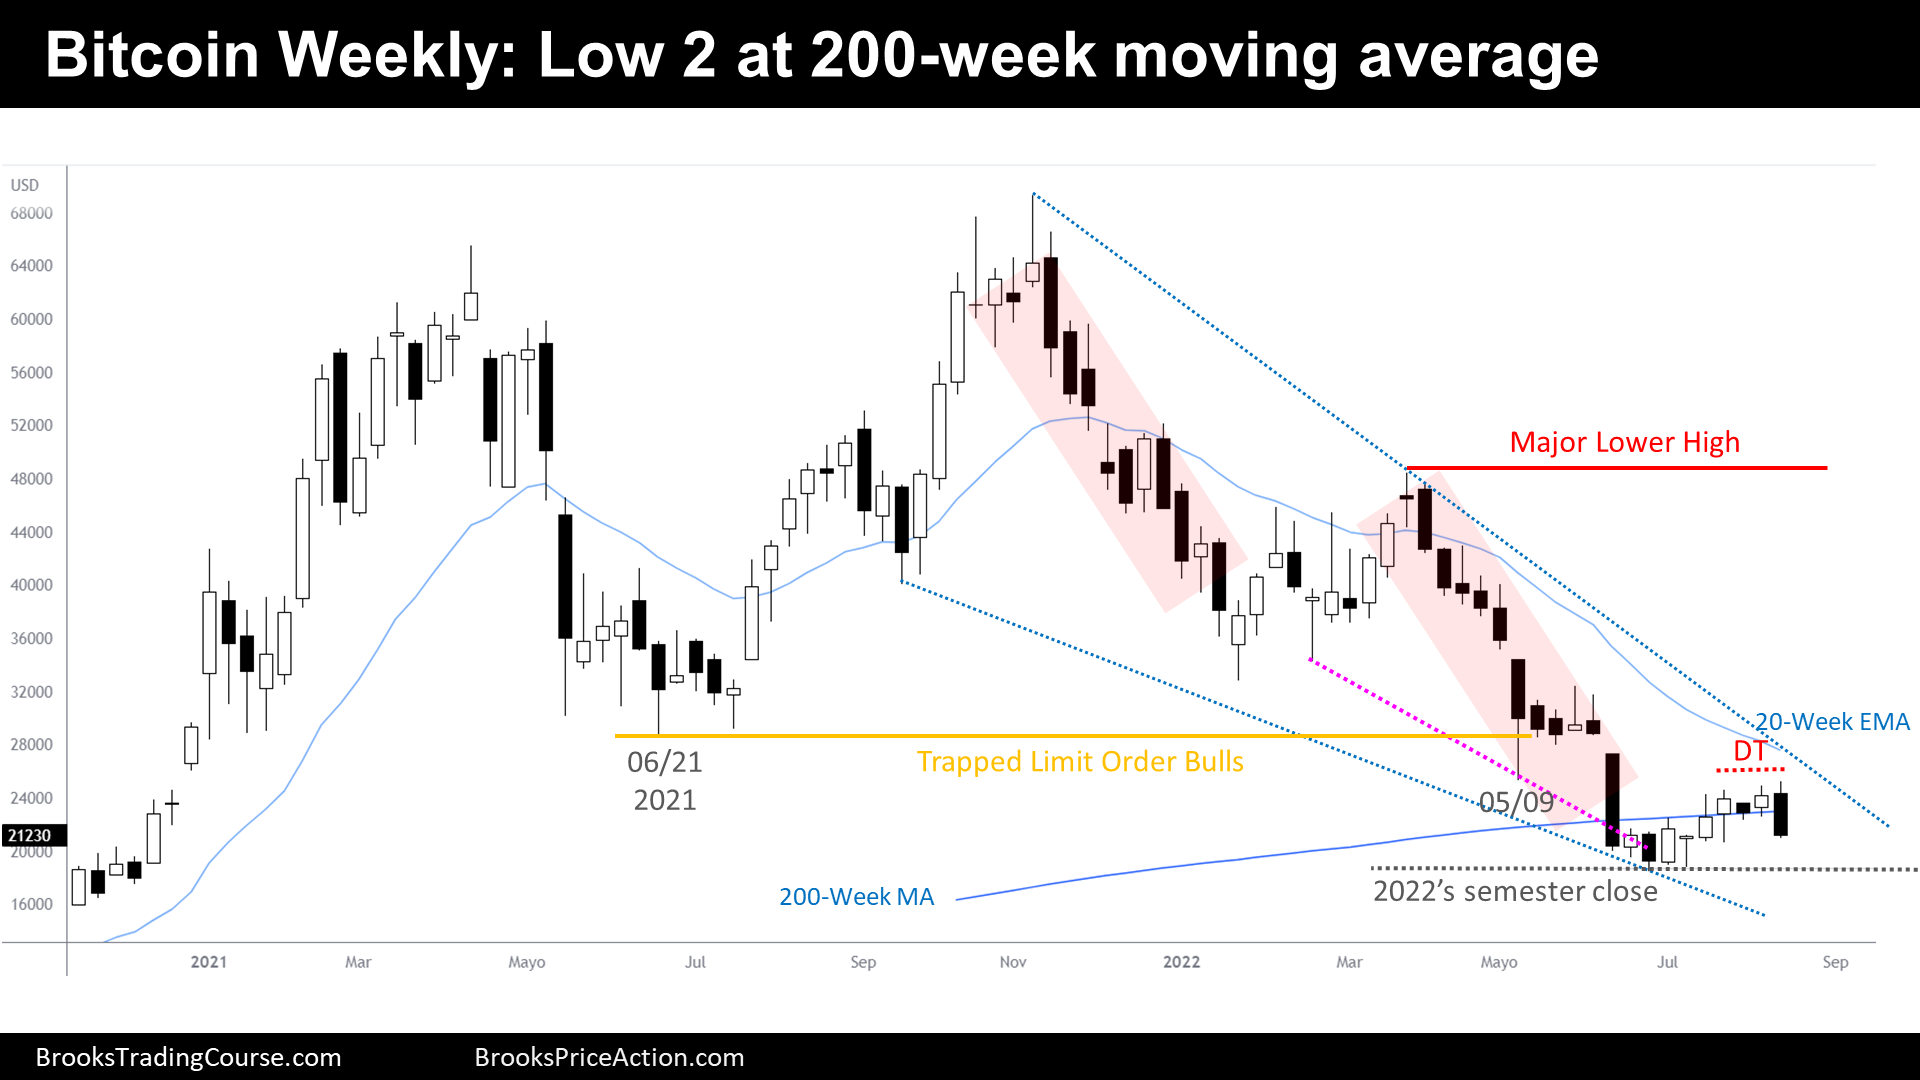
The Weekly chart of Bitcoin futures

- This week’s Bitcoin candlestick is an outside down sell signal bar.
- Furthermore, it is a Low 2 bear flag pattern, closing below the 200-week moving average.
- Traders noticed that the price could not trade at or above the 5/9 low. Hence, this might be a failed test of resistance, a sign of strength for bears.
- We have been saying that this year there should be a test of the year lows, because the prior bear leg was strong enough to generate, at least, another leg sideways to down.
- We also said that this might be a two legs sideways to up move after a wedge bottom pattern.
- Both scenarios might be true or even converge.
- Bears want a resumption of the bear channel, a breakout below the lows of the year, and a test of the 2017’s close. After the failed test of 5/9, odds increased in favor of this scenario.
- Bulls, however, want to see a bad follow through bar for the bears next week. They think that we are at a buy zone of a major trading range, and that good bear trend setups are going to fail. They expect trapped bears around the lows of the year, and they hope that they will buy back their shorts to get out breakeven when they have a chance.
- Both scenarios are reasonable:
- Bear channel resumption.
- Failed bear breakout and another leg sideways to up.
- We have been insisting on the idea that the price is contained within a trading range market cycle.
- If in the following weeks, the bears fail to trade below the 2022’s low and the price get back to above the 200-week moving average, traders might consider that the price is bottoming.
- But if the next week, or weeks, there is good bear follow through selling, traders might conceive that there is a 3rd major leg down underway, which might test the 2017’s close.
- If enough traders are confused about the future direction of the price, we should expect trading range price action; consequently, next week will possibly disappoint bulls and bears by creating a bar with tails on both ends.
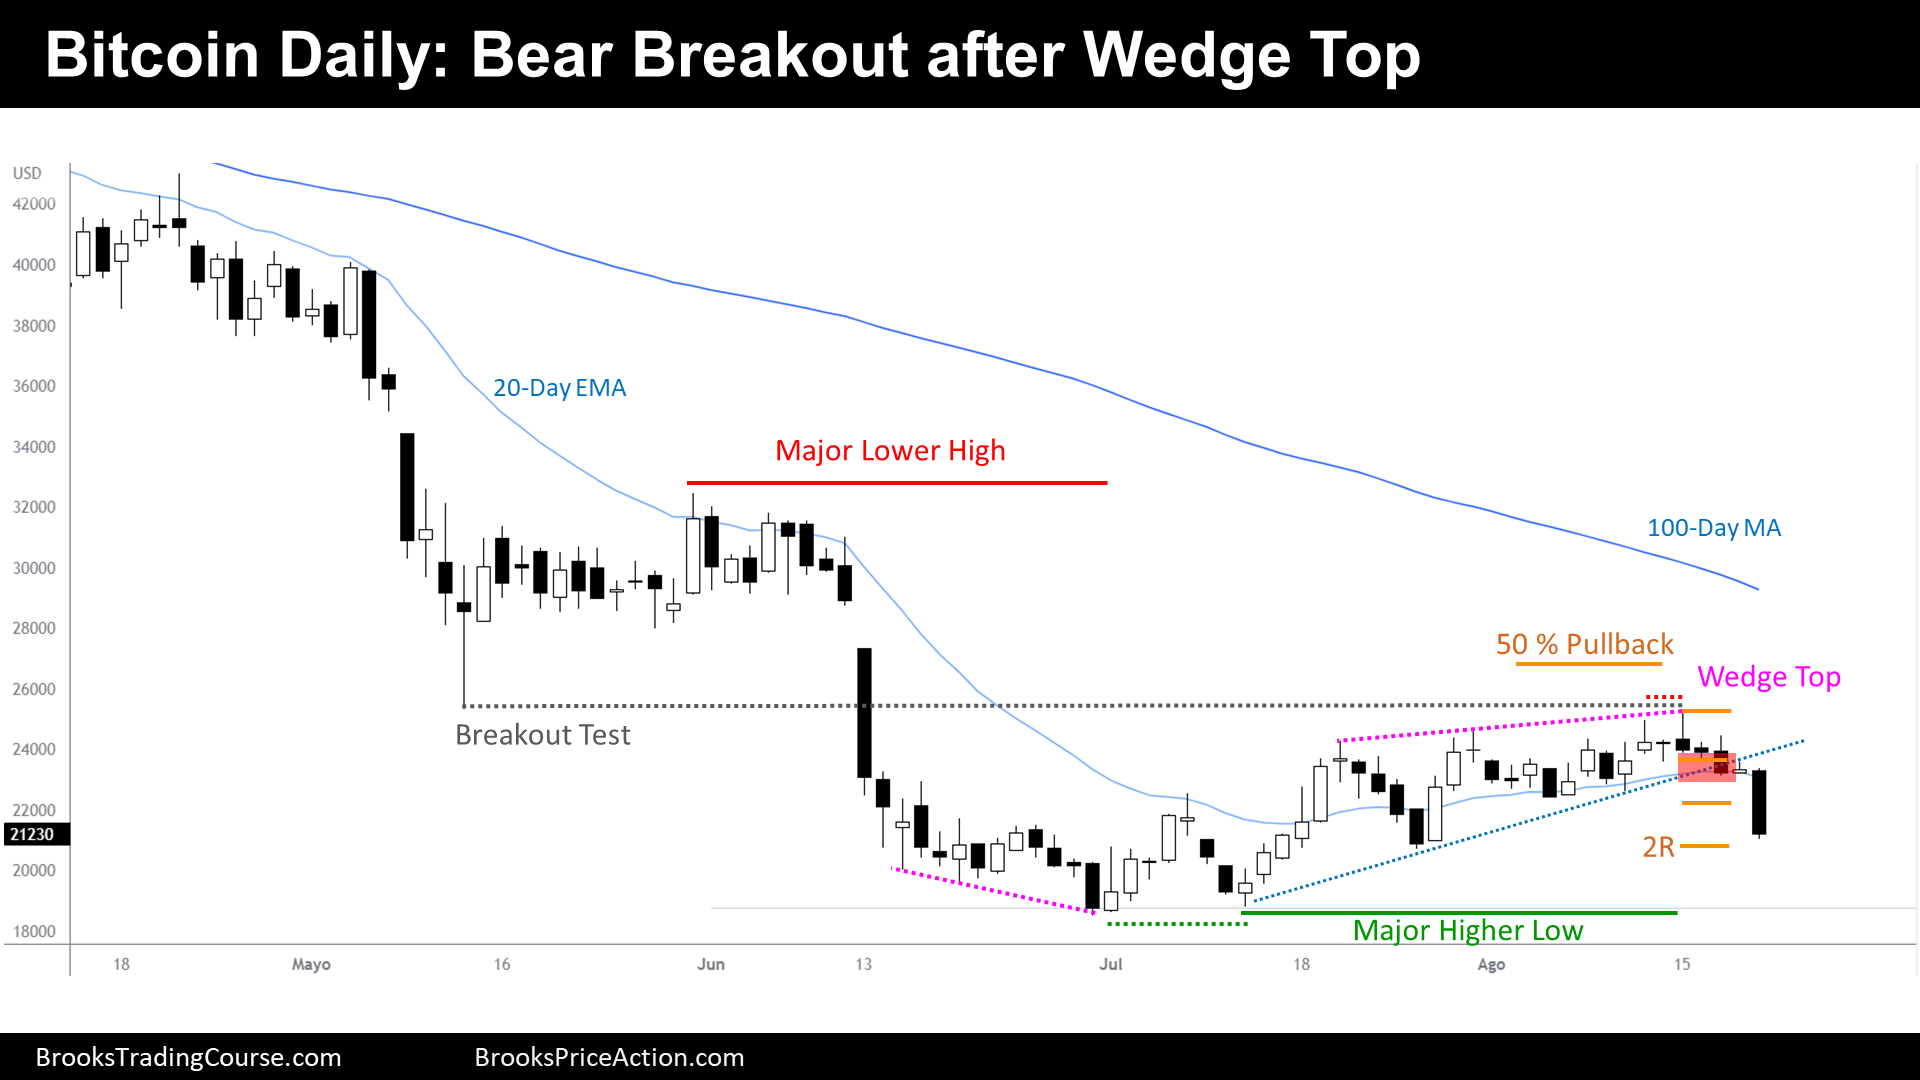
The Daily chart of Bitcoin futures

- The Bitcoin Futures achieved a higher high of the bull channel during the first day of the week, and then it failed, becoming a wedge top: three pushes up of a bull channel.
- After the sell signal bar on Monday, bears had good follow through during the days that followed. Not only that, the bear momentum has been increasing during the bear breakout.
- After a wedge top, traders expect two legs sideways to down. The bear leg that we have seen this week, is possibly only the first of two bear legs.
- The goal for the bears is to trade below the major lower high. There, trend bulls will watch how their bull channel thesis is completely invalidated.
- Bulls hope to see a strong bull bar after Friday’s bear breakout bar. They want to see a higher low double bottom and a test of the August highs.
- But the most important observation here might be that both bulls and bears are making money by buying low and selling high, with stop order setups. This means that before reversals, we can expect reversal patterns to develop: wedges or doubles top/bottoms.
- We are in a trading range, another common outcome is a reversal after a 2nd leg trap.
- Because we had a strong bear leg after a wedge top, we should expect within the next weeks, at least, a 2nd leg down, before there is a test of the highs.
- But if selling is persistent during the next following days, this bear leg could become the start of a bear breakout of the trading range.
- More likely, there will be some kind of bearish pause during the next week.
Market analysis reports archive
You can access all weekend reports on the Market Analysis page.

