Market Overview: Bitcoin Futures
Bitcoin futures are trading around major price level, which is the 2017 close. After 5 years of trading at the Chicago Mercantile Exchange, the Bitcoin futures test a price that acted as the hardest resistance before the major bull trend that occurred after COVID-19 crash.
Bitcoin futures
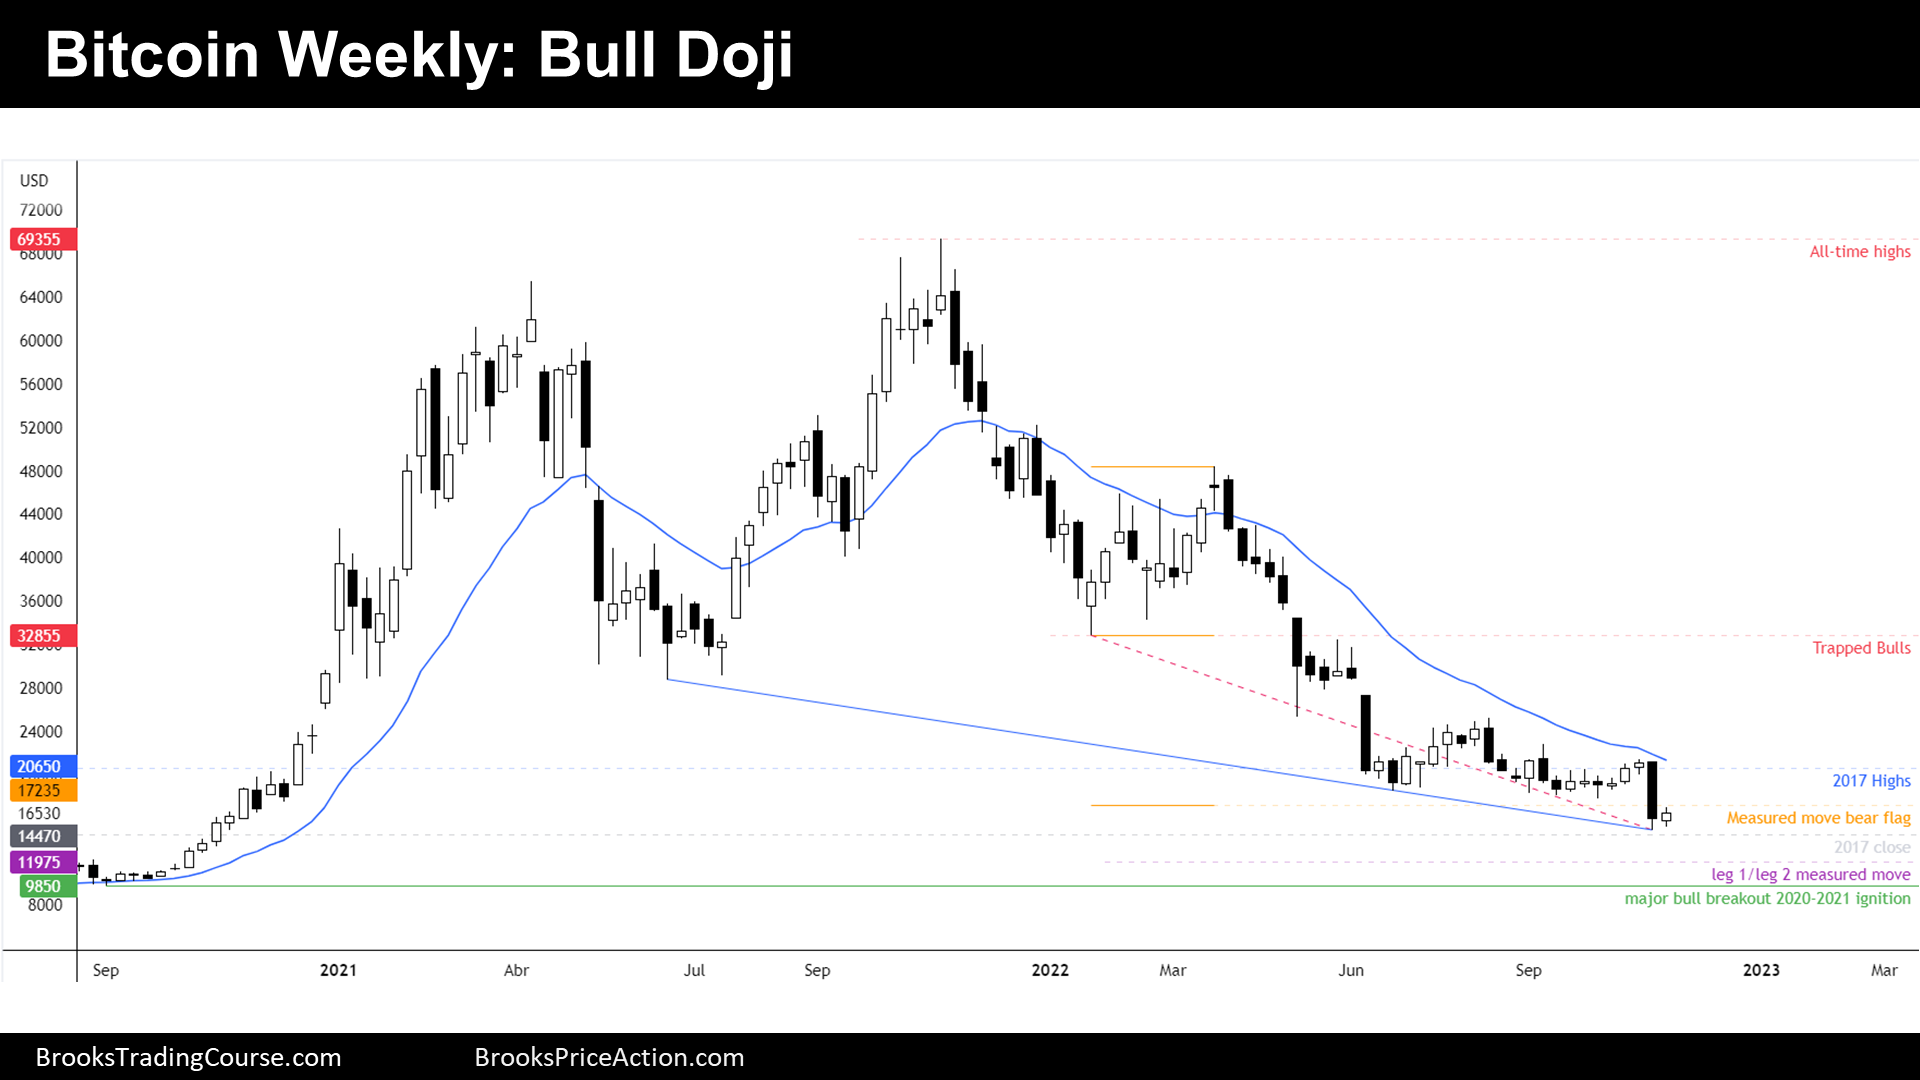
The Weekly chart of Bitcoin futures

- This week’s candlestick is a bull doji. It is an inside bar following a bear breakout.
- During the last report, we have said that we were expecting bullish pressure during the week.
- Moreover, since June, we are saying that the most important price level on this chart is probably the 2017 close. It is a paramount important level because it was the closing price of the Bitcoin futures on his 1st year of trading at the Chicago Mercantile Exchange. It should be viewed as the institutional verdict. The fact of the price being there after 5 years, should tell us something.
- The exact price level (2017 close) is $14470, which was not reached during the recent bear breakout; hence, it will act as a magnet until is not reached.
- Traders think that this is probably the price area where it will end the trend down. Until that happens, we prefer to assume that we are in a bear trend. Everyone is looking to buy here: the bears, to take profits. The Bulls, seeking for a major reversal.
- The bears reached their most significant targets, but there other on play, which the leg 1/leg 2 measured move at $11975 and the major bull breakout ignition point at $9850 -which would end, technically, the major bull trend on higher timeframes.
- We should expect a bull reversal happening within the next months, at least until $25000.
- The next week is a Low 1 sell signal bar, but it is a bull bar so it is not a strong signal. For the bulls, it is a failed breakout of a bear flag, a possible final flag, but it is a small bar that has a tail above, so it is not a strong buy neither.
- The best the bears can do it is wait until there is a retracement to around resistances like the 20-week exponential moving average or at around $25000.
- Math is pretty good for the Bulls, the price sits at a major support, their risk is at $9845 (major higher low on higher timeframes) and their target, at a minimum, is at $25000.
- Even if we see lower prices this year, we should expect a bull reversal within the following months.
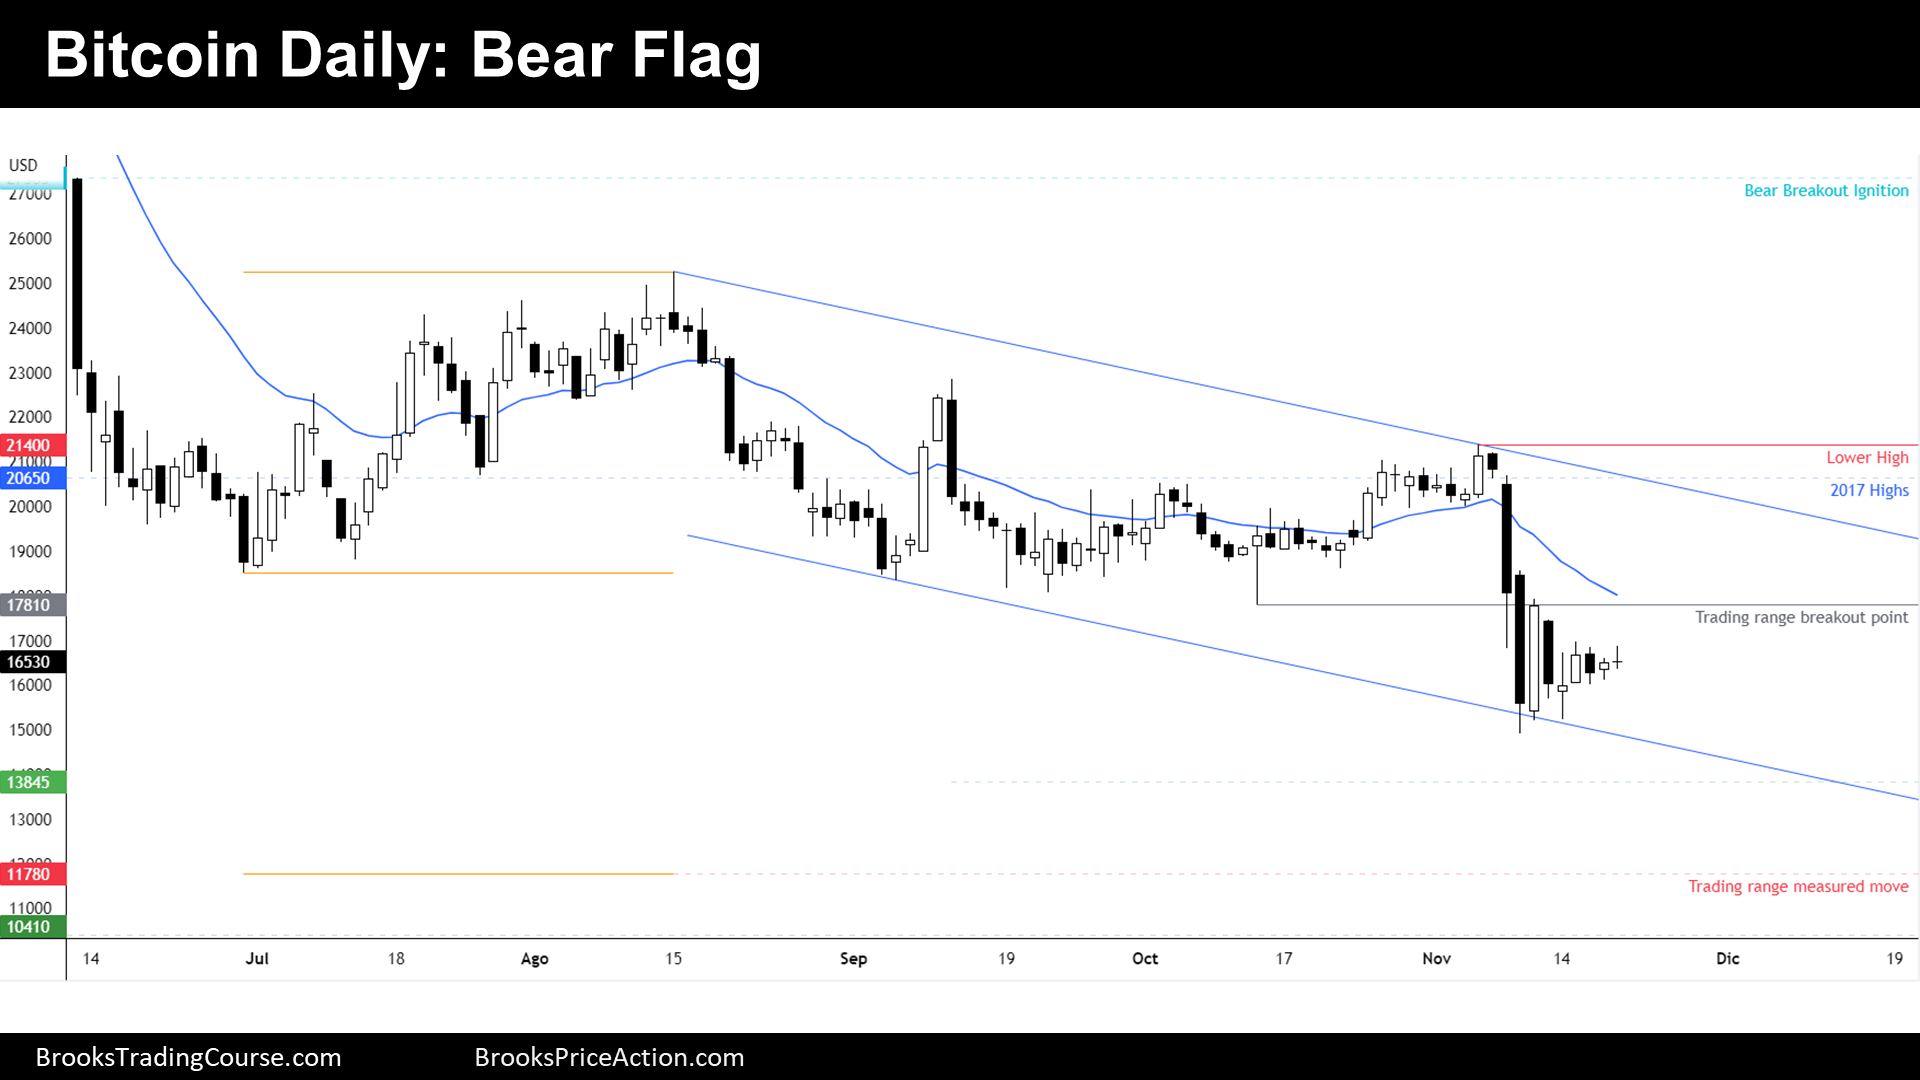
The Daily chart of Bitcoin futures

- Last week we have said that we should expect bears to exit around the low of the bear breakout because the breakout was not as strong as it could be. The price bounced on Monday, after testing the breakout lows.
- During the week, the price entered a tight trading range, forming a small triangle pattern. Because this pattern comes after a bear breakout, it should be viewed as a bear flag. But it could also be a final flag.
- As we pointed out during the last report, there was a bear breakout of a 5-month trading range. We can draw a broad bear channel, which is also a bear trending trading range.
- After the bear breakout, the price closed the gap left between the bear breakout low and breakout point of the trading range, which means that bulls buying below things are making money if they scale in. This is why I do not expect a strong bear trend; hence, I do not expect that the bears can break down the most important price level of this chart, 2017 close at $14470.
- Of course, the bears may reach the measured move target based upon the size of the 5-month trading range, but, as stated, I think this is not going to happen soon.
- The context, for now, favors limit order trading, which means that traders looking for swing trades better wait until seeing consecutive bars in either direction.
- The price could test quickly $14470 at anytime, but traders should expect higher prices during the following weeks ahead.
Market analysis reports archive
You can access all weekend reports on the Market Analysis page.

