Market Overview: Bitcoin
Bitcoin started the week on a high note, the previous week’s candlestick closing as a strong bull bar. This fueled expectations for a retest of the prior week’s high, but the current weekly bar paints a different picture. It’s shaping up as a bearish reversal, suggesting bulls are losing steam as the price encounters resistance.
Adding another twist, the month is ending next week with a bullish bar currently above the previous month’s high. This creates a battleground at the weekly close. Bulls want to close above the prior month’s high for further gains, while bears aim to push the price below it, initiating a potential a retracement.
This month’s high, and the past month’s high, become magnets, attracting the price. The weekly close next week will be crucial, revealing the stronger force and shaping the medium-term direction.
Bitcoin
The Weekly chart of Bitcoin

This week’s Bitcoin price action on the weekly chart paints a picture of a bullish trend encountering resistance and exhibiting signs of potential consolidation or pullback.
The chart is within a well-established bull trend, evidenced by a rising channel. Recently, the price experienced a strong bull breakout, that tested the upper channel boundary.
The repeated breakouts decrease the probability of a successful escape from the bull channel. Instead of aiming for a measured move up based on the size of the bull breakout, a retest of the lower trendline of the channel is considered more likely. This signifies a potential period of consolidation or a pullback.
As the bull channel matures, a natural market cycle tendency is to end up transitioning into a trading range. This scenario suggests limited opportunities for significant price gains in the medium term.
Based on the analysis, traders can anticipate several possibilities:
- Retracement and Trend Continuation: The price might retrace downward, testing the lower trendline of the bull channel before resuming the upward trajectory.
- Trading Range Formation: The price could enter a consolidation phase, forming a trading range. This scenario presents limited opportunities for large profits, but may offer scalping possibilities for experienced traders.
Considering the potential for a pullback or consolidation, and the lower probability of a successful bull breakout of the bull channel, near-term bearish sentiment is gaining ground. Bears aim for a Low 3 Top pattern, which would involve the price falling below the low of the previous bar. Bulls and bears will probably sell if the Low 3 is a bear bar closing below its midpoint.
While the overall outlook suggests caution, bulls might find buying opportunities during potential retracements down to the lower trendline.
Conclusion: Based on the weekly chart analysis, traders should be prepared for sideways or downward movement in Bitcoin during March. The lower probability of a further bull channel breakout and the potential for a trading range warrant a cautious approach for the coming weeks.
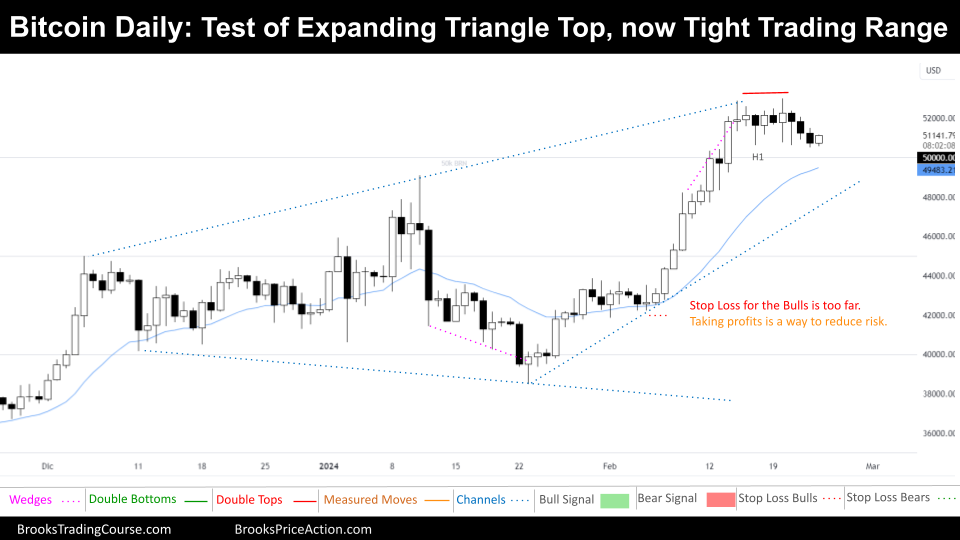
The Daily chart of Bitcoin

The price is within a large expanding triangle. As mentioned in previous reports, there are diverging interpretations of the daily chart:
- Broad Bull Channel: Some see a broad bull channel, a continuation of the bull trend with deep pullbacks.
- Expanding Triangle: Others favor the expanding triangle, indicating uncertainty about the next directional move.
- Spike and Channel Bull Trend: A smaller camp sees the possibility of a spike forming the beginning of a new channel bull trend. However, this option is considered less likely due to the influence of higher timeframe trends.
Currently, the price is far removed from the major higher low, indicating a large bull breakout without significant retracement. This suggests that early bulls might be overextended and seeking to reduce risk by taking profits, contributing to the current tight trading range.
This narrow trading range could be a precursor to a reversal. The longer the price remains sideways, the less influence the previous trend holds, eventually reaching a point where there’s a 50% chance for either a bullish or bearish breakout.
In case of a bullish breakout, bulls would likely raise their stop-loss orders below the tight trading range low to limit downside risk. Conversely, a bearish breakout would see bears place their stop-loss orders above the tight range high to manage risk. Both scenarios aim for a 1:2 risk:reward ratio.
Acknowledging the higher timeframe’s possible sideways to downward bias, the author anticipates a sell opportunity below the tight trading range or after a failed bullish breakout. However, a monthly chart closing above January’s high could prompt a test of February’s high, potentially invalidating this bearish view.
That concludes this week’s Bitcoin market analysis. We hope this information proves valuable as you navigate the ever-evolving landscape.
Your insights and perspectives are always appreciated! You are welcome to share your thoughts and engage in a discussion by leaving a comment below. Additionally, if you found this report informative, consider sharing it with your network to help others stay informed!
Until next week, happy trading!
Josep Capo
Market analysis reports archive
You can access all weekend reports on the Market Analysis page.

