Market Overview: Bitcoin
Bitcoin finds itself at a pivotal juncture. The prolonged bullish momentum that propelled prices to record highs is showing signs of waning. While the long-term outlook remains favorable, the coming days and weeks could see a shift in market dynamics.
Recent price action reveals a climactic surge followed by consolidation, with buyers hesitant to push higher. This suggests a potential test to the downside, though strong support levels could temper any bearish moves. The daily chart highlights a delicate balance within a Triangle Pattern, signaling a period of range-bound trading is likely.
Are we witnessing a temporary pause before the bulls regain control, or is a more significant correction looming? The full report delves deeper, analyzing key price levels, potential scenarios, and the implications for traders. Stay tuned for a detailed breakdown of the weekly and daily Bitcoin charts!
Bitcoin
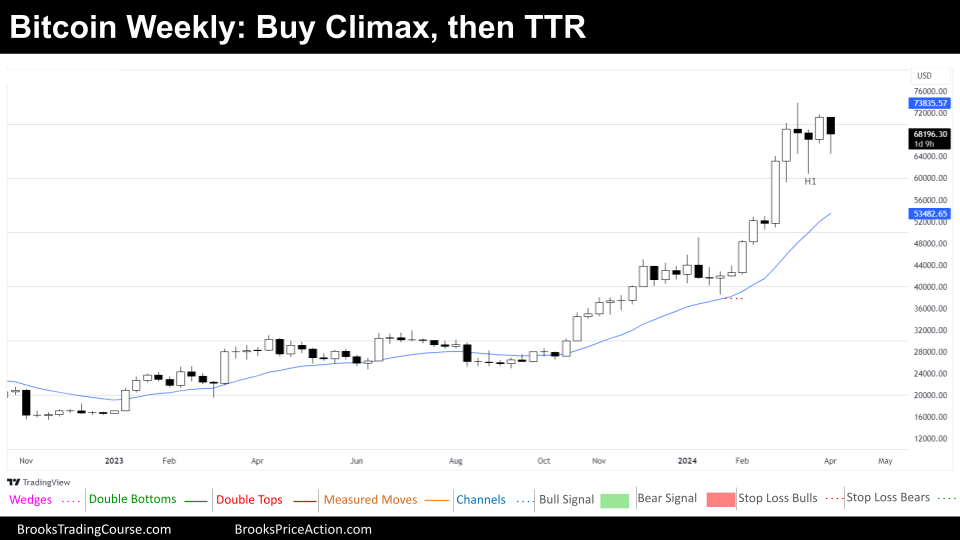
The Weekly chart of Bitcoin

Bitcoin continues Always in Long, maintaining its position within a prolonged Tight Bull Channel. Yet, recent volatility and price behavior suggest buyers may be losing some of their previous dominance, potentially leading to a shift in the near-term market dynamic.
After a climactic test of the prior all-time highs, Bitcoin has entered a four-week characterized by sideways price action. This follows last week’s strong bull bar, which ultimately faced significant selling pressure. Notably, the H1 setup signaled indecision with a doji formation within a Buy Climax context. The hesitation of buyers to sustain upward momentum after strong bull bars could point to a potential downside test.
However, the presence of potential buyers below the H1 level, coinciding with the first low of a 6-bull micro channel on the monthly chart, may serve to limit the extent of any bearish moves. This indicates that while the path of least resistance might favor some downside exploration, a sharp decline seems less likely. Instead, we anticipate a period of range-bound trading to unfold.
While technical patterns like the Buy Climax often indicate a 40% chance of reaching a measured move up around $100,000, there’s also a 60% possibility of revisiting the Buy Climax low below $40,000. These targets, however, seem distant in the current environment. Effective risk management playing those levels would prove challenging. A more probable scenario involves extended sideways action or a gradual drift downwards.
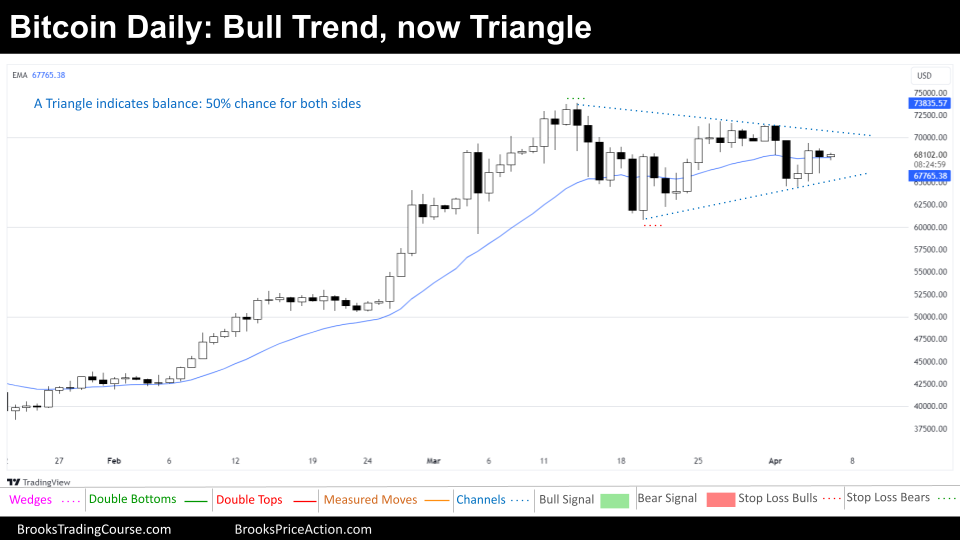
The Daily chart of Bitcoin

The daily chart for Bitcoin paints a picture of neutrality. Neither bulls nor bears have managed to establish a decisive leg, resulting in a range-bound trading environment. Furthermore, the market has formed a Triangle Pattern, a specific type of trading range characterized by converging price action. This highlights the current balance of power between buyers and sellers.
Within a Triangle Pattern, the odds of a successful breakout to either the upside or downside are roughly equal at 50%. Bulls tend to view this pattern as a continuation signal, representing a reaccumulation phase before further upward movement. Conversely, bears see it as a potential reversal pattern, suggesting a distribution phase before a downtrend.
However, it’s important to acknowledge that the market could simply continue sideways, temporarily breaking above the Triangle’s lower high before reversing downwards, or dipping below the higher low before reversing upwards. It can also extend this pattern, with the price oscillating above and below the Triangle’s boundaries before eventually returning within the range.
Remember, higher timeframes indicate an overextended market that has already surpassed average size moves. While the long-term outlook may still favor bulls, a prolonged trading range is likely to precede any continuation of the bullish trend.
All market cycles begin with a breakout. If a clear breakout occurs on either side, the current trading range thesis will be invalidated. Traders should remain vigilant and be prepared to reassess their market outlook in the face of such a decisive price move.
Thank you for reading! Your engagement and insights are invaluable. Please share your thoughts, comments, and questions below. Let’s foster a dynamic discussion among fellow traders. And don’t forget to share this report within your network!
Market analysis reports archive
You can access all the weekend reports on the Market Analysis page.

