Market Overview: Bitcoin Futures
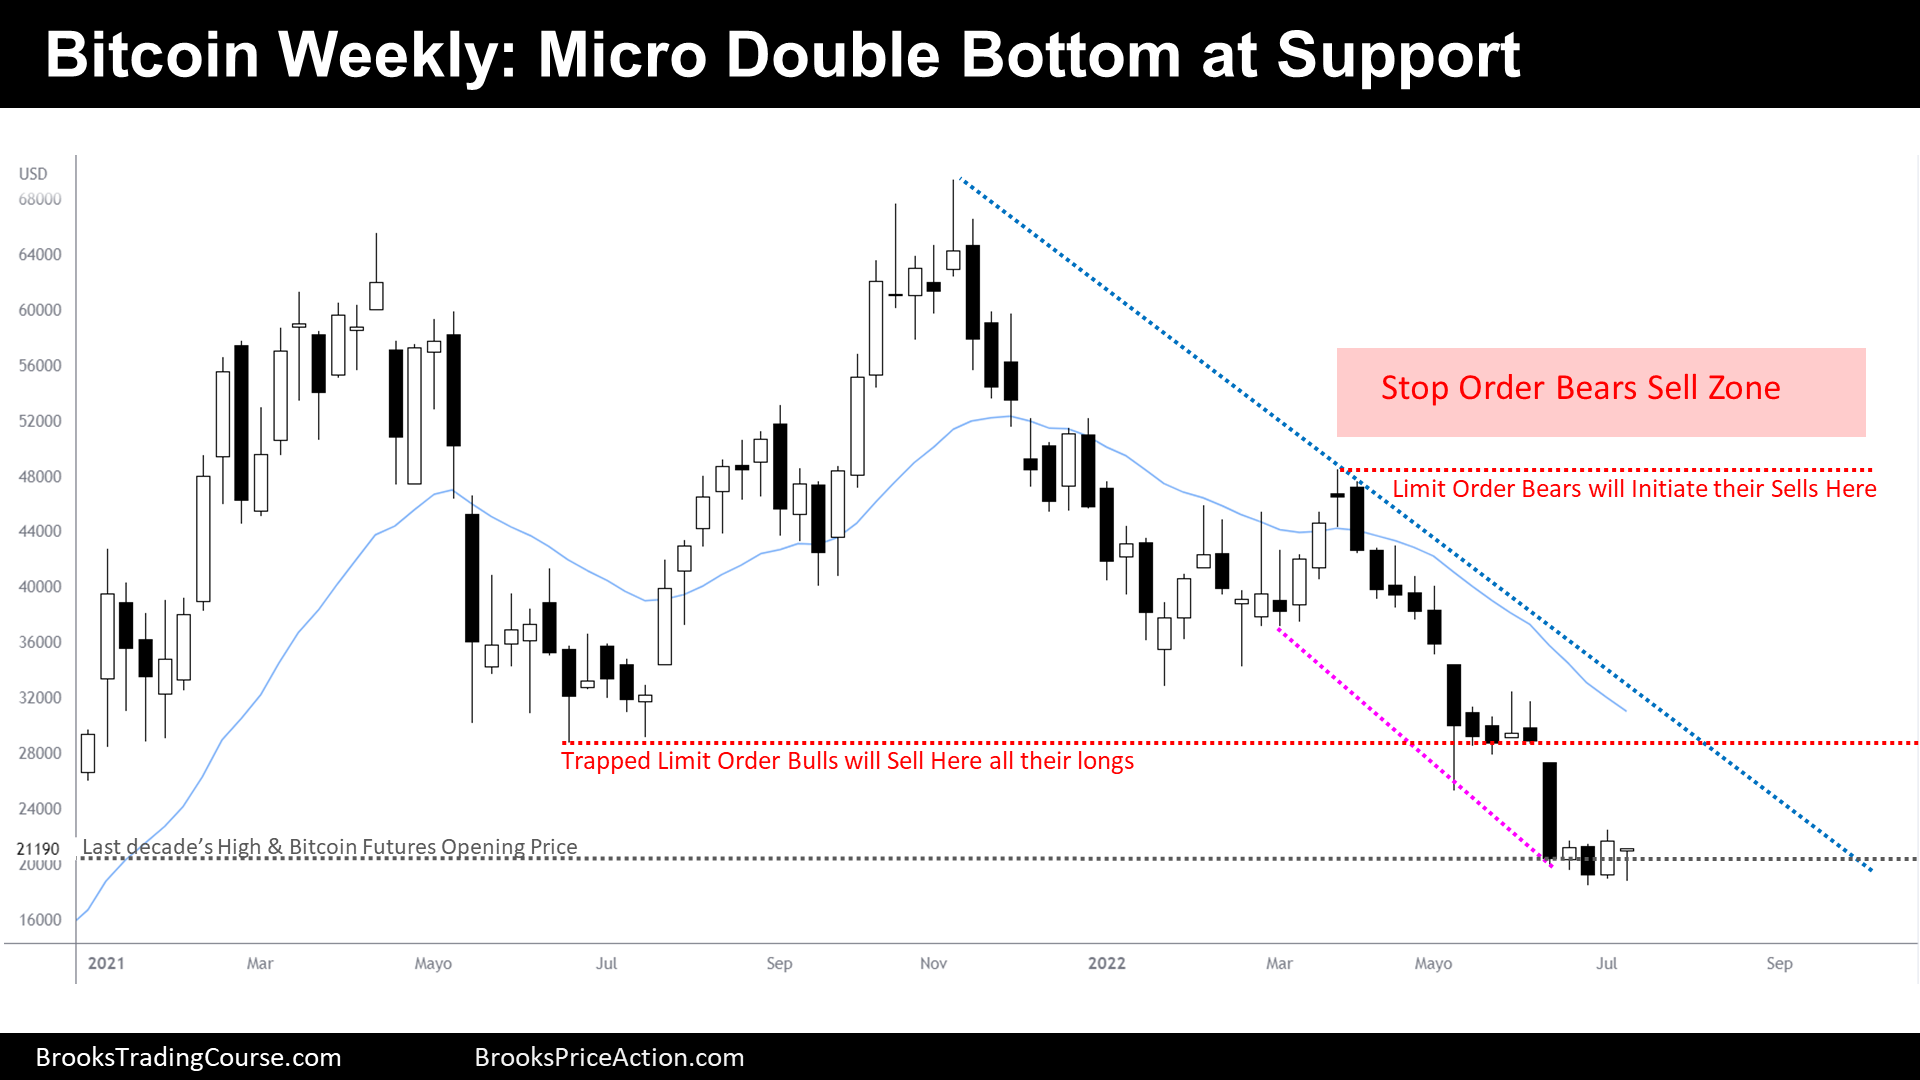
Bitcoin micro double bottom and attempt to end the bear trend, as they are trying to consolidate a short-term bottom; still, it is too early to believe that the end of the Major Drawdown is near.
Bitcoin futures
The Weekly chart of Bitcoin futures

- On prior reports, we have highlighted the following features of the Bitcoin Futures Weekly Chart:
- The price structure has not changed, but it looks like a Pullback of this bear trend is imminent.
- This week traded below last week’s low and then reversed up. It is the 2nd consecutive week with the same behavior.
- Some strong Bears that sold the Bear Breakout placed a Limit Order Buy below the last weekly bar, meaning that they might not be confident about a Breakout of the Major Support.
- The Bulls might see this as a High 2 at a Major Support, hence, an opportunity to buy.
- The Bears want a Failed High 2 and resume the trend down until the next support, which is the 2017’s close at $14470.
- Odds are that both Bulls & Bears will be disappointed soon, as the bullish upside is limited due to Limit Order Bulls trapped at around $29000. We know that they will add selling pressure to any pullback… because they are going to sell there.
- It also means that the 1st attempt to reverse up will probably fail, and that the best that Bulls can get is sideways trading between $29000 and $18525 during the following couple of months.
- Are the Bears going to sell at around $29000? They took profits lately around these prices, it does not make sense for them to sell again here. More likely, they will wait ten bars, two legs sideways to up.
- Conclusions:
- $29000 is a strong magnet above because Institutions are trapped there.
- The bear trend might need those sellers (Limit Order Bulls) before resuming down.
- We have seen that around the Major Support, there might not be enough incentives to continue selling.
- The next week, the price will probably close above current week high.
The Daily chart of Bitcoin futures

- The Daily chart of the Bitcoin Futures is trading within a well-constructed Bear Channel.
- When a Bear Channel is well constructed, the 1st attempt to reverse up, normally, it does not go very far.
- The price looks like it is bottoming, as we can see a Wedge Bottom and a Double Bottom Higher Low Major Trend Reversal.
- Last 10 days we have seen 7 bull bars, a behavior that we have not seen since the end of the 1st quarter.
- As we have written last week, Stop Order Bulls have good math with the current price structure. This is because we have bottoming patterns at a major support while there are strong magnets above (trapped Limit Order Bulls on Weekly chart at around $29000).
- But last week we anticipated that the 1st reversal up after a well-constructed bear trend, it normally looks feeble: gaps of prior highs close. This week, we have seen gaps of prior good bull bar highs closed.
- Actually, this is a typical behavior within Trading Ranges.
- Are we in a Trading Range?
- As we have said, the retracement it is not technically significant yet to consider the bear trend over, but it is true that the context on this and on higher timeframes favor a deeper Pullback.
- While the retracement continues to be undistinguished, we should be cautious about looking to the upside; however, we know that the math works for Stop Order Bulls:
- Probability is low (at a minimum between 30% & 40%) but there are no sellers around (resistances) until a reward 3:1 risk from current prices.
- Conclusion:
- A Higher Low Major Trend Reversal also means that after a bear trend, we have seen two legs sideways to up; Therefore, the bears want this 2nd leg up to fail and form a Double Top that leads to a new low.
- If that were to happen, traders will see these two legs up as a possible final flag of the bear trend; hence, bears selling around these prices will be quicker to take profits than those who are intending to sell around higher prices.
- As we have seen on the Weekly Chart, it is not likely that next week will have good bull bars, more likely we will see a bull doji, or a bull bar with a tail above.
- This means that in case the Bull Major Trend Reversal continues, it will keep closing gaps between the price and prior highs.
- If we continue up, we should expect a Trading Range, and therefore, we should trade it like a Trading Range. Presumably, the Trading Range will be between $29000 and $18525.
- It is very unlikely that the price will reverse up to the very top of the Bear Channel soon. Well-constructed trends resist well during a long period of time.
- A Higher Low Major Trend Reversal also means that after a bear trend, we have seen two legs sideways to up; Therefore, the bears want this 2nd leg up to fail and form a Double Top that leads to a new low.
Market analysis reports archive
You can access all weekend reports on the Market Analysis page.

