Market Overview: Bitcoin
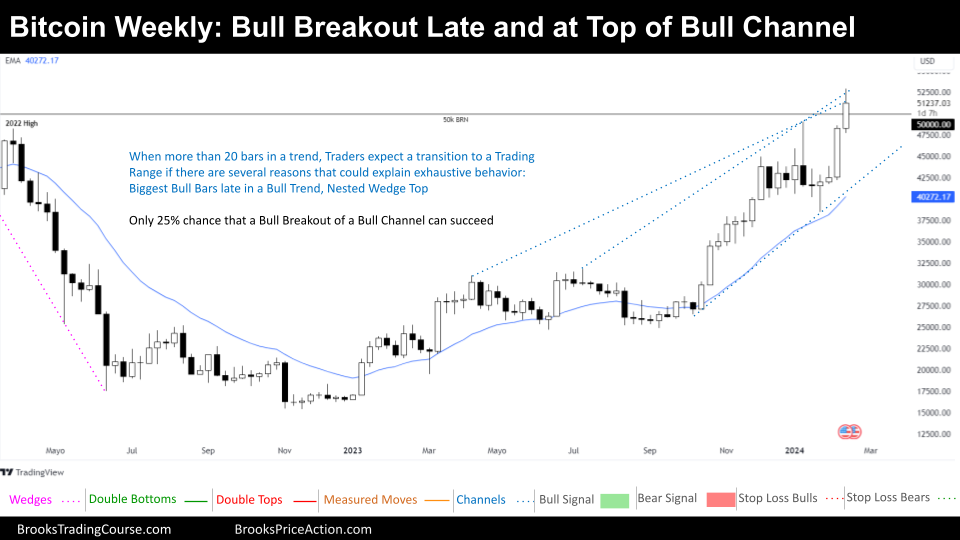
Bitcoin is trading above the significant psychological level of 50,000 Big Round Number (BRN) for the first time since 2021. Examining the weekly chart, we observe a consistent uptrend in price action, however, as Bitcoin continues its ascent, questions arise regarding the sustainability of this Bull Trend. Will the current bullish momentum persist, propelling Bitcoin to further highs? Or are we on the brink of a transition into a Trading Range, signaling a potential period of consolidation?
Bitcoin
The Weekly chart of Bitcoin

This week witnessed Bitcoin’s price continuing its robust ascent, notably surpassing the significant milestone of 50,000. Over the past two weeks, the price exhibited an explosive upward movement, culminating in its current position at the upper trend line of a Bull Channel. Within the market cycle, Bitcoin is firmly entrenched in a Bull Channel, signaling sustained upward momentum.
However, as Bitcoin extends its Bull Trend, traders are vigilant for signs of a potential transition into a Trading Range. Typically, after approximately 20 bars in a Bull Trend, traders begin scrutinizing for indications of exhaustion in the prevailing trend. The recent price action, characterized by a late-stage bull breakout and the formation of a Nested Wedge Top pattern, suggests potential exhaustion in the Bull Trend.
Anticipating a shift in market cycle, many Bulls riding the Bull Trend may opt to sell their positions, and raise the remaining positions with stop losses likely placed below the January Low. Should Bitcoin indeed enter a Trading Range cycle, the initial target would be the January Low.
While some Bears may seize the opportunity to sell at this week’s close, placing stop losses above the high of the week entails considerable risk, particularly if the week concludes above its midpoint. Bears planning to put their stop loss a Measured Move up away from the Bull Breakout, do not plan their stop loss to ever get hit and will consider exiting if the price action proves they are mistaken.
The distance from the 20-week Exponential Moving Average and the presence of multiple exhaustion signals deter Bulls from considering high entries.
In conclusion, despite Bitcoin’s ongoing Bull Trend, caution prevails amidst mounting signs of potential exhaustion. Bulls are inclined to await lower entry points, assessing the strength of Bears before committing further. As uncertainty looms, rational decision-making trumps emotion-driven impulses like the Fear Of Missing Out.
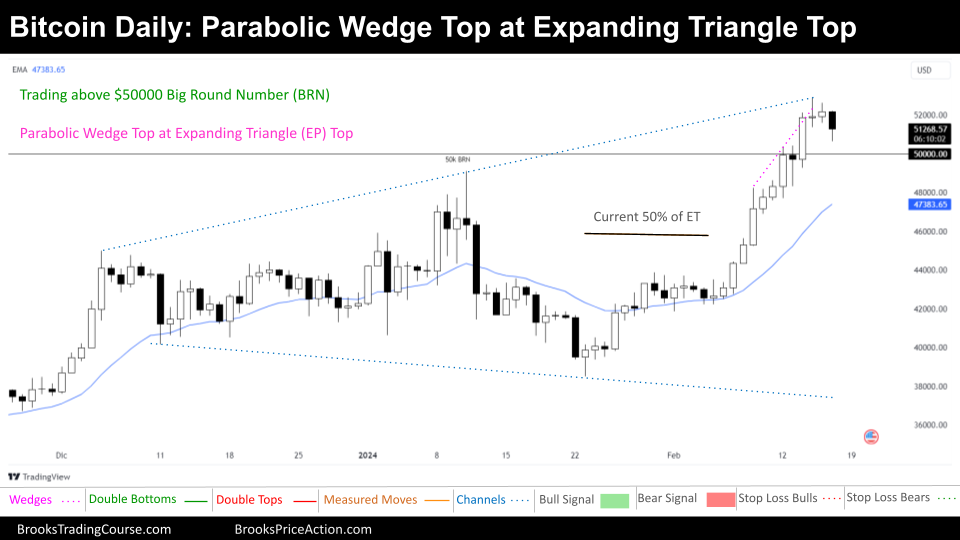
The Daily chart of Bitcoin

The recent price action indicates a test of the upper boundary of an Expanding Triangle Pattern, which is a Trading Range Pattern. While the current market cycle appears to resemble a Tight Bull Channel in the short term, a broader perspective reveals characteristics more aligned with a bull leg within a Broad Bull Channel.
In a scenario indicative of a Broad Bull Channel, traders may consider buying above prior highs, albeit with caution, as they do only if they can scale in at lower levels to manage the risk associated with deep pullbacks and potential transitions into Trading Range patterns.
Traders operating within a Broad Bull Channel often seek opportunities to buy at a 50% pullback or upon witnessing a reversal from such a level. Alternatively, buying around the bottom third of a Trading Range, as suggested by the Expanding Triangle Pattern, is also a viable strategy. Selling above prior highs presents an opportunity for bears to scalp profits, they only do if they are able to scale in at higher levels.
There’s uncertainty regarding whether the current market cycle is a Broad Bull Channel, or if this is just the start of a Spike and Channel Bull Trend. We do not know even if the Bull Spike phase has concluded, prompting a cautious approach. For bears, anticipating a Bull Climax might lead to premature actions. It’s essential to exercise patience and wait for Always In Short.
In conclusion, the analysis of this chart indicates several key observations. Firstly, the current price action places us at the upper boundary of an Expanding Triangle pattern, suggesting a potential reversal zone.
Secondly, the ongoing bullish breakout might also represent a bull leg within a Broad Bull Channel. This implies that while the immediate trend may be bullish, traders should remain mindful of potential pullbacks and transitions into trading range patterns.
Lastly, there’s a possibility that the current market trend could align with a Spike and Channel Bull Trend scenario. However, this outcome is considered less likely compared to the other scenarios discussed. Nonetheless, it remains a plausible scenario that traders should monitor and adapt their strategies accordingly.
Your insights and perspectives are invaluable to fostering the Brooks Price Action community of traders and analysts. Please have no hesitation to share your thoughts in the comments section below and engage with fellow participants. Additionally, if you found our analysis insightful and helpful, share them with your network! Together, we can continue to learn, grow, and navigate the complexities of the market more effectively. Your participation and support are greatly appreciated!
Josep Capo
Market analysis reports archive
You can access all the weekend reports on the Market Analysis page.

