Market Overview: Bitcoin Futures
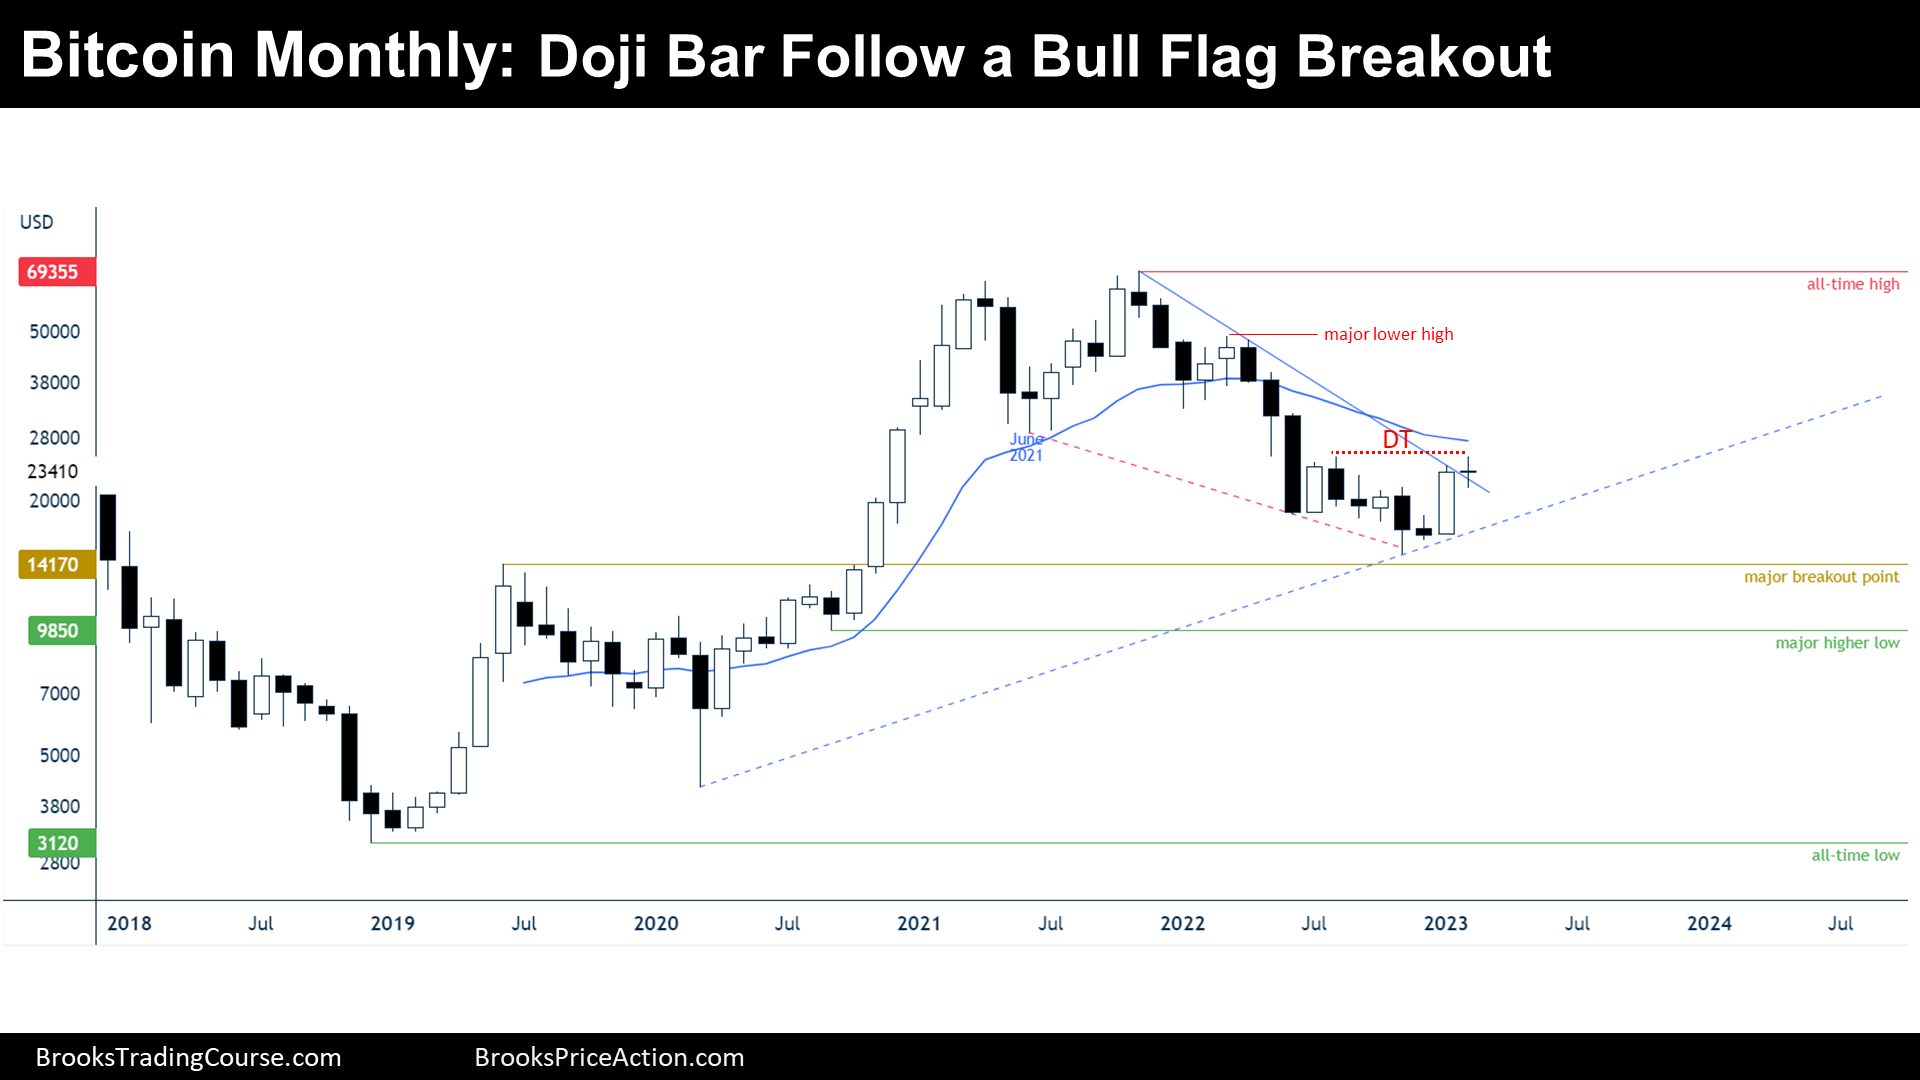
Bitcoin Futures doji bar following bull flag breakout. During February, the price barely increased +0.69 of its value. Bitcoin is attempting to reverse a tight bear channel. So far, Bulls achieved some milestones and hence, limited the downside risks.
Bitcoin futures
The Monthly chart of Bitcoin futures

Analysis
- February’s candlestick is a doji bar with a tiny bull body. The doji bar follows a bull breakout of a bull flag. Moreover, this bar forms an almost perfect double top with August high. The doji bar is a disappointing follow-through bar for the Bulls.
- Throughout the reports, we have said that the context is more likely a trading range than a bear trend. After January’s strong bull breakout bar, we have said that the context was more likely a trading range than a bull trend reversal.
- Trading ranges tend to disappoint both bulls and bears looking for trends to be developed.
- The bear trend (or the bull flag) has been tight and, in consequence, there are bulls that bought during the downtrend and are still trapped into their long positions.
- When trends are tight, the first reversal up is normally minor, so counter trend traders (Bulls in this case) normally take quick profits.
- But the long-term context looks like a broad bull channel (or a bull trending trading range) because the price is above the major higher low after a strong bull breakout: bulls will probably hold a second reversal up after a double bottom or a higher low with 2022 lows.
- Nowadays, the context is either:
- Bulls want:
- The price to get to the June 2021 low: there, there are trapped bulls that are limiting a serious reversal up. A failed bear trend resumption: they will have better odds if they wait for the formation of a bottom like a double bottom, a head and shoulders bottom, or a tight trading range above the 2022 low.
- Bears want:
- A resumption down after the double top. They know that bulls are making money buying below things, so they will take quick profits. In consequence, they do not expect the price to get far if they get lower lows, but their final goal still ends the long-term bull trend by trading down until they reach the major higher low.
- Bulls want:
- Since February is disappointing for those bulls who bought above January’s bull signal bar, they will probably get out their positions at breakeven, which means that there are sellers above January’s close. It is more likely a test of the February lows than highs during March’s candlestick.
Trading
- Bulls: February is not a good signal bar for stop order bulls, neither for limit order bulls. Stop order bulls will prefer waiting for a failed reversal down, and limit order bulls might prefer to buy below January’s low.
- Bears: February is a double top setup with a not strong sell signal bar for stop order bears. Limit order bears prefer to sell at the June 2021 low, and stop order bears might sell below February, but others may wait to sell below a bar with a bear body.
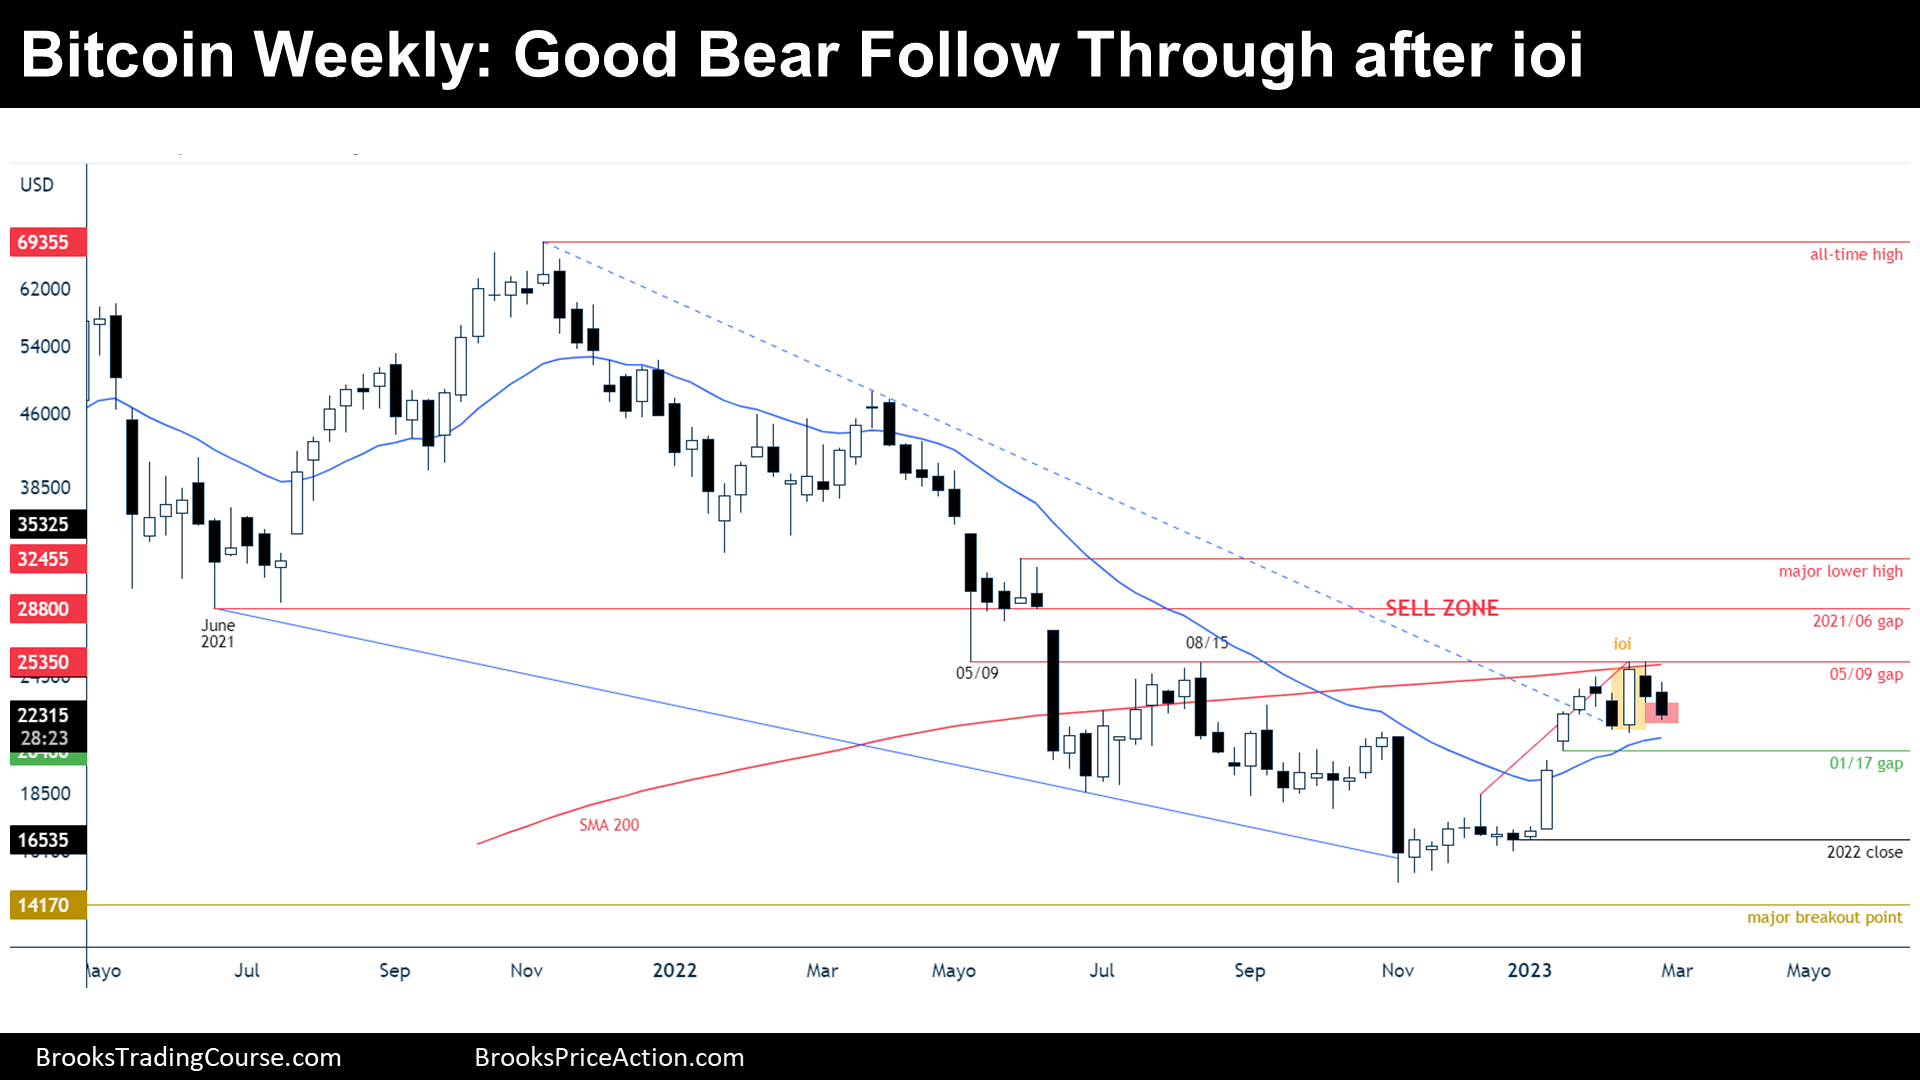
The Weekly chart of Bitcoin futures

Analysis
- This week’s candlestick is a bear bar, closing around its low. It is the follow-through bar after last week’s bear setup: wedge top, double top and ioi at the 200-week moving Average (SMA 200).
- The bull leg ignited in January was able to trade above October’s high and reach the 15th August high; therefore, bears have not great chances of getting a new low after such a reversal up.
- The context is more likely a trading range rather than a major bull trend reversal or a broad bear channel.
- Nowadays, the price is either:
- Bull case: after two consecutive good bear bars, bulls might not expect a small pullback bull trend anymore, unless there is a strong bull bar next week or after testing the 20-day exponential moving Average (20 EMA). More likely, they will end up buying a 50% retracement or after a higher low major trend reversal, betting on a second leg up testing the June 2021 to develop.
- Bear case: Bears know that the odds of getting around the 2022 close are not great now, so they might take profits early even after the formation of the topping patterns. There might be trapped bears at the 17th January low, bears that were betting that the gap between the price and the 13th January high was about to close. In consequence, they will buy the current reversal down, limiting downside risks.
Trading
- Bulls: bulls will buy above a good buy signal bar coming out from a failing bear breakout or from the EMA. Preferably, they will buy a higher low major trend reversal at around a 50% retracement because they know that bears will also buy around that level.
- Bears: bears might sell low if the bearish momentum grows next week by forming a bigger bear breakout bar, closing around its low. Other bears will wait to sell higher, above a Low 1 or after a failed new high.
Market analysis reports archive
You can access all weekend reports on the Market Analysis page.

