Market Overview: Bitcoin
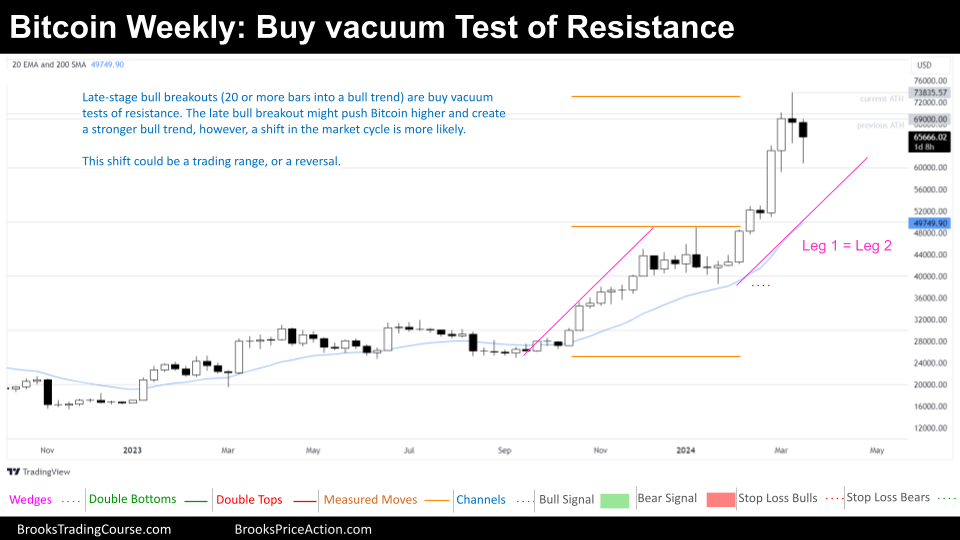
Bitcoin faces a potential trend reversal after failing to sustain momentum above its previous all-time high. This week’s price action dipped below the prior low, snapping a seven-week winning streak on the weekly chart. Our previous analysis anticipated aggressive bears selling a doji bar after a buy vacuum test of resistance, and this played out as expected. Will the price continue its downward trajectory until the buy climax low, or can bulls regain control?
Bitcoin
The prices depicted on our charts are sourced from Coinbase’s Exchange Spot Price. It’s crucial to note that the spot price of Bitcoin is continuously in motion; trading activity never ceases. This means that market fluctuations and price changes occur around the clock, reflecting the dynamic nature of cryptocurrency trading.
The Weekly chart of Bitcoin

The Always in Long weekly chart suggests a fundamental bias for appreciation, but the situation demands closer scrutiny.
The recent bull breakout, technically a positive move, occurs within a larger, established bull channel. This late-stage breakout within a bull channel can often be a signal that the overall trend is reaching maturity and could be susceptible to a reversal. As we discussed last week, these breakouts can function as buy vacuum tests of resistance, attracting new buyers before a potential reversal.
Therefore, while the breakout itself is bullish, the context proposes a higher likelihood of a transition into a trading range rather than an immediate continuation of the strong uptrend. This is further reinforced by the recent price reversal after reaching a major resistance level.
A bullish perspective might interpret the recent price action as a healthy pullback within a tight bull channel. This view would suggest buying opportunities below the prior bar. However, ignoring the broader context of the late-stage bull breakout and the major resistance level reached would be a risky move.
This week, a technical buy signal emerged as the price dipped below the prior week’s low after a 7-week bull micro channel. However, this signal is overshadowed by the larger concerns surrounding the bull channel’s maturity and the recent reversal at a major resistance.
Bulls remain optimistic and will likely continue buying on strong setups like a High 2 or High 3 reversal pattern if bears fail to gain momentum in the coming weeks. These patterns indicate a potential resumption of the uptrend despite the recent pullback.
While bears haven’t established a strong presence yet, their initial success in pushing the price lower suggests they may continue to exert pressure in the following weeks.
This week’s chart analysis presents conflicting signals for both bulls and bears. Traders are wise to adopt a wait-and-see approach, closely monitoring future price action and confirmation signals for either a continuation of the uptrend or a transition into a trading range.
The Daily chart of Bitcoin

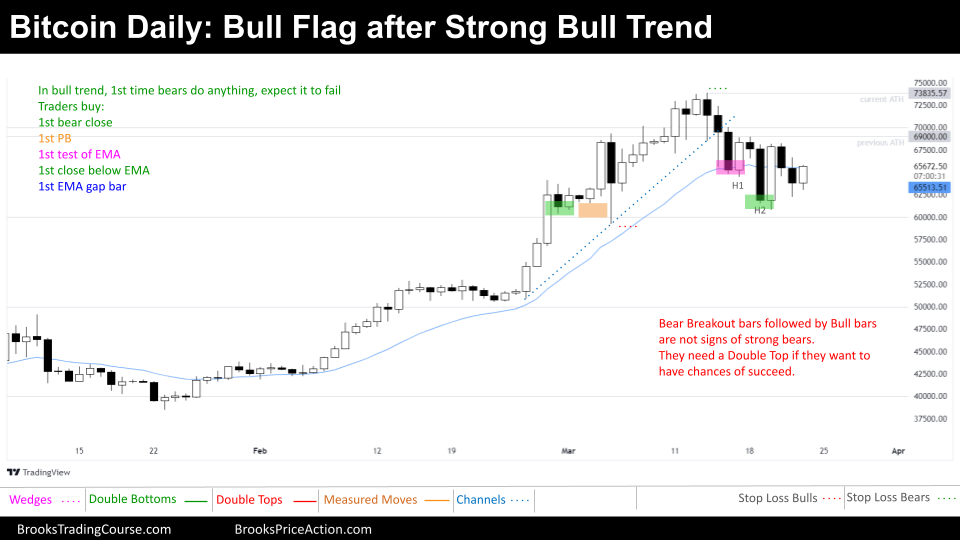
The daily Bitcoin chart presents a tug-of-war between bulls and bears, lacking the clear Always in Long or Always in Short direction. This follows a strong bull trend that culminated in a parabolic wedge top, leading to the current pullback.
The prevailing interpretation among traders is that the price action is currently forming a bullish flag pattern. This pattern proposes a potential resumption of the uptrend after a healthy consolidation. However, it’s crucial to acknowledge the broader context.
While bulls have successfully defended previous bearish attempts since the breakout above $50,000, their recent efforts haven’t been as fruitful. A promising High 1 setup failed to materialize, as it is anticipated after a period of overbought (parabolic wedge top late in bull channel) conditions. While a High 2 offered a better chance for a reversal, it unfortunately triggered above a strong bear breakout bar.
Bulls are now pinning their hopes on a successful High 3 pattern with a bull body. Additionally, they’re eyeing an opportunistic entry point at the first gap that forms below the 20-day exponential moving average (EMA). Considering the price stalling at resistance, these trades might be better suited for quick profits, at least partials may be taken.
Bulls are placing their stop losses below the major higher low around $60,000. If a gap below the 20-period EMA forms below this level, the stop loss might be adjusted to the prior major higher low that is right above $50,000.
The future trajectory hinges on how the price reacts at the current level. If the bulls can muster the strength to retest the all-time high, it could signal a major trend reversal attempt. However, if the price continues to drop without attempting a retest, it could morph into a V-shaped top, a notoriously difficult pattern to profit from.
The current price action lacks a definitive Always in Long or Always in Short signal, suggesting a potential range-bound period with reversal opportunities even if clear direction at some point, due to the presence of a price range on the left side of the chart further reinforces this notion.
That’s all for this week’s Bitcoin analysis! As always, the market presents a complex puzzle. We hope this breakdown provided valuable insights for your trading decisions.
Remember, your participation is what fuels this blog! Feel free to share your thoughts, questions, and alternative analyses in the comments below. Let’s keep the conversation going and help each other navigate the ever-evolving Bitcoin landscape. Additionally, if you found this content helpful, consider sharing it with your fellow traders to spread the knowledge!
We look forward to delving back into the charts with you all next week. Until then, happy trading!
Josep Capo
Market analysis reports archive
You can access all the weekend reports on the Market Analysis page.

