Market Overview: Bitcoin Futures
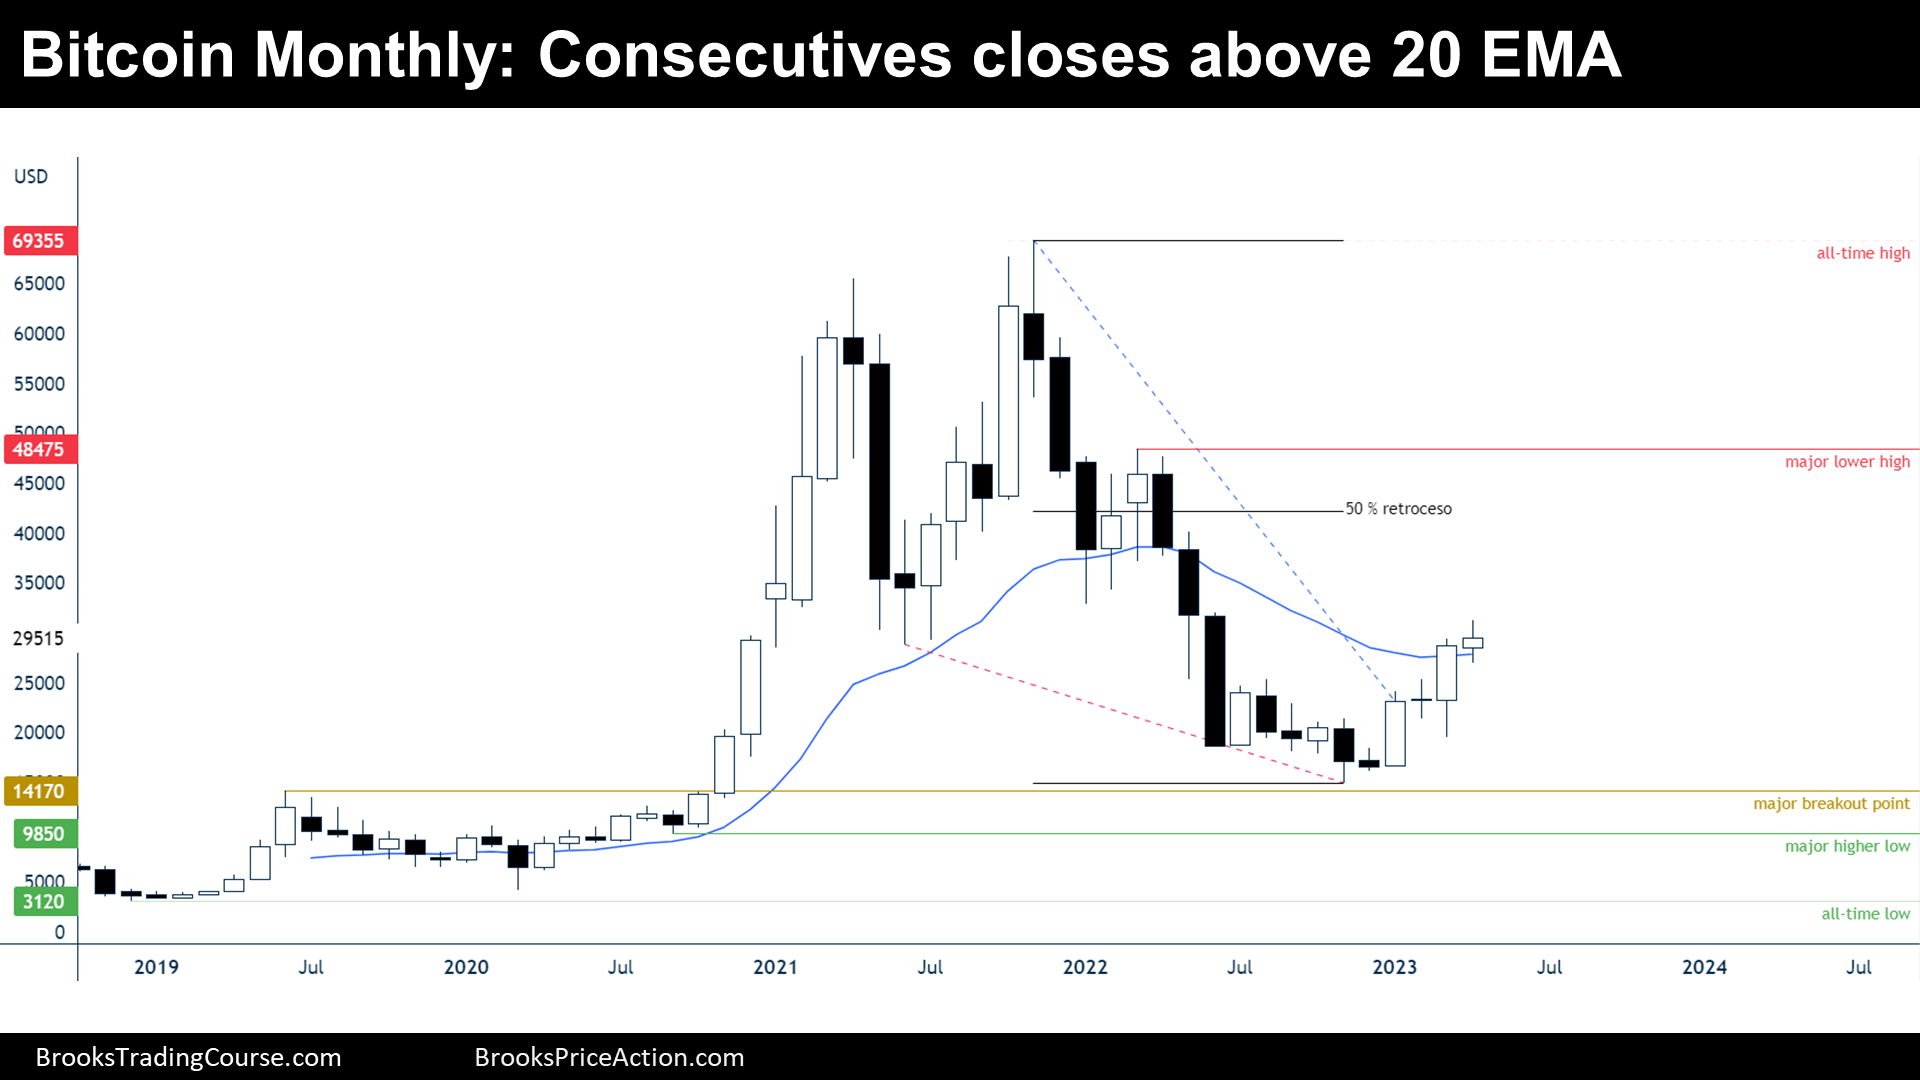
Bitcoin consecutive closes above 20-month EMA. Bitcoin futures increased its value +2.71% during April. Furthermore, during the month, the price achieved a 100% rally from 2022 lows.
Bitcoin futures
The Monthly chart of Bitcoin futures

Analysis
- April’s candlestick is a bull doji bar, not a good follow through bar after March buy signal bar; however, now there are two consecutive bull bars above the 20 Exponential Moving Average (20 EMA).
- The context is likely a broad bull channel, since the price holds above the major higher low after a major bull breakout occurred during 2020-2021.
- The main pattern that we can spot on this chart is a bull flag. This year, the price broke the flag to the upside after a wedge bottom.
- But within the bull flag, there is a tight bear channel, and hence, there is an 80% chance that the first reversal up will be minor.
- Furthermore, the tight bear channel contains a major lower high, since the price broke below a minor higher low after that pullback.
- The major lower high will probably act as a resistance if bulls manage to get there; hence, the price will oscillate between $15000 and $50000 for a couple of years.
- In the near term, Traders wonder if May will repeat the 2023 pattern as follows: strong bull bar, bad bull follow through, strong bull bar, bad bull follow through, strong bull bar?
- Nowadays, the different participant’s perspective might look something like this:
- Bulls:
- The first reversal up will likely fail, and hence, this is just a bull leg instead of a bull major trend reversal.
- They hope that the leg rallies up to the 50% retracement or to the major lower high, before there is a bear leg down.
- But they also know that if there is a leg down that fails to get below the 2022 low and reverses up, their chances of a major trend reversal would be much higher.
- Bulls bought aggressively this year when the price was at $20000, it might have to go there before it reaches $35000 or $40000.
- Bears:
- They know that the first reversal up after the bull flag breakout will likely fail; however, they also know that the general context is a broad bull channel and there might not be much room for them on the downside.
- Their goal is to get to the major higher low, to technically invalidate the long-term bull trend the thesis. Nowadays, a 50% retracement of the 2021-2022 selloff is more likely than that.
- Since the price rallied a 100% from the 2022 low, there might be some profit taking and hence, traders should expect some sideways to down trading during May.
- Bulls:
Trading
- Bulls:
- April is not a good stop order buy signal bar. The context favors another leg down starting within the next few bars, so they might prefer to wait until there is a second attempt to reverse the tight bear channel.
- Bears:
- April is not a good stop order sell signal bar. They might prefer to wait to sell below a bear bar closing at its low, or during a reversal down at around the 50% retracement.
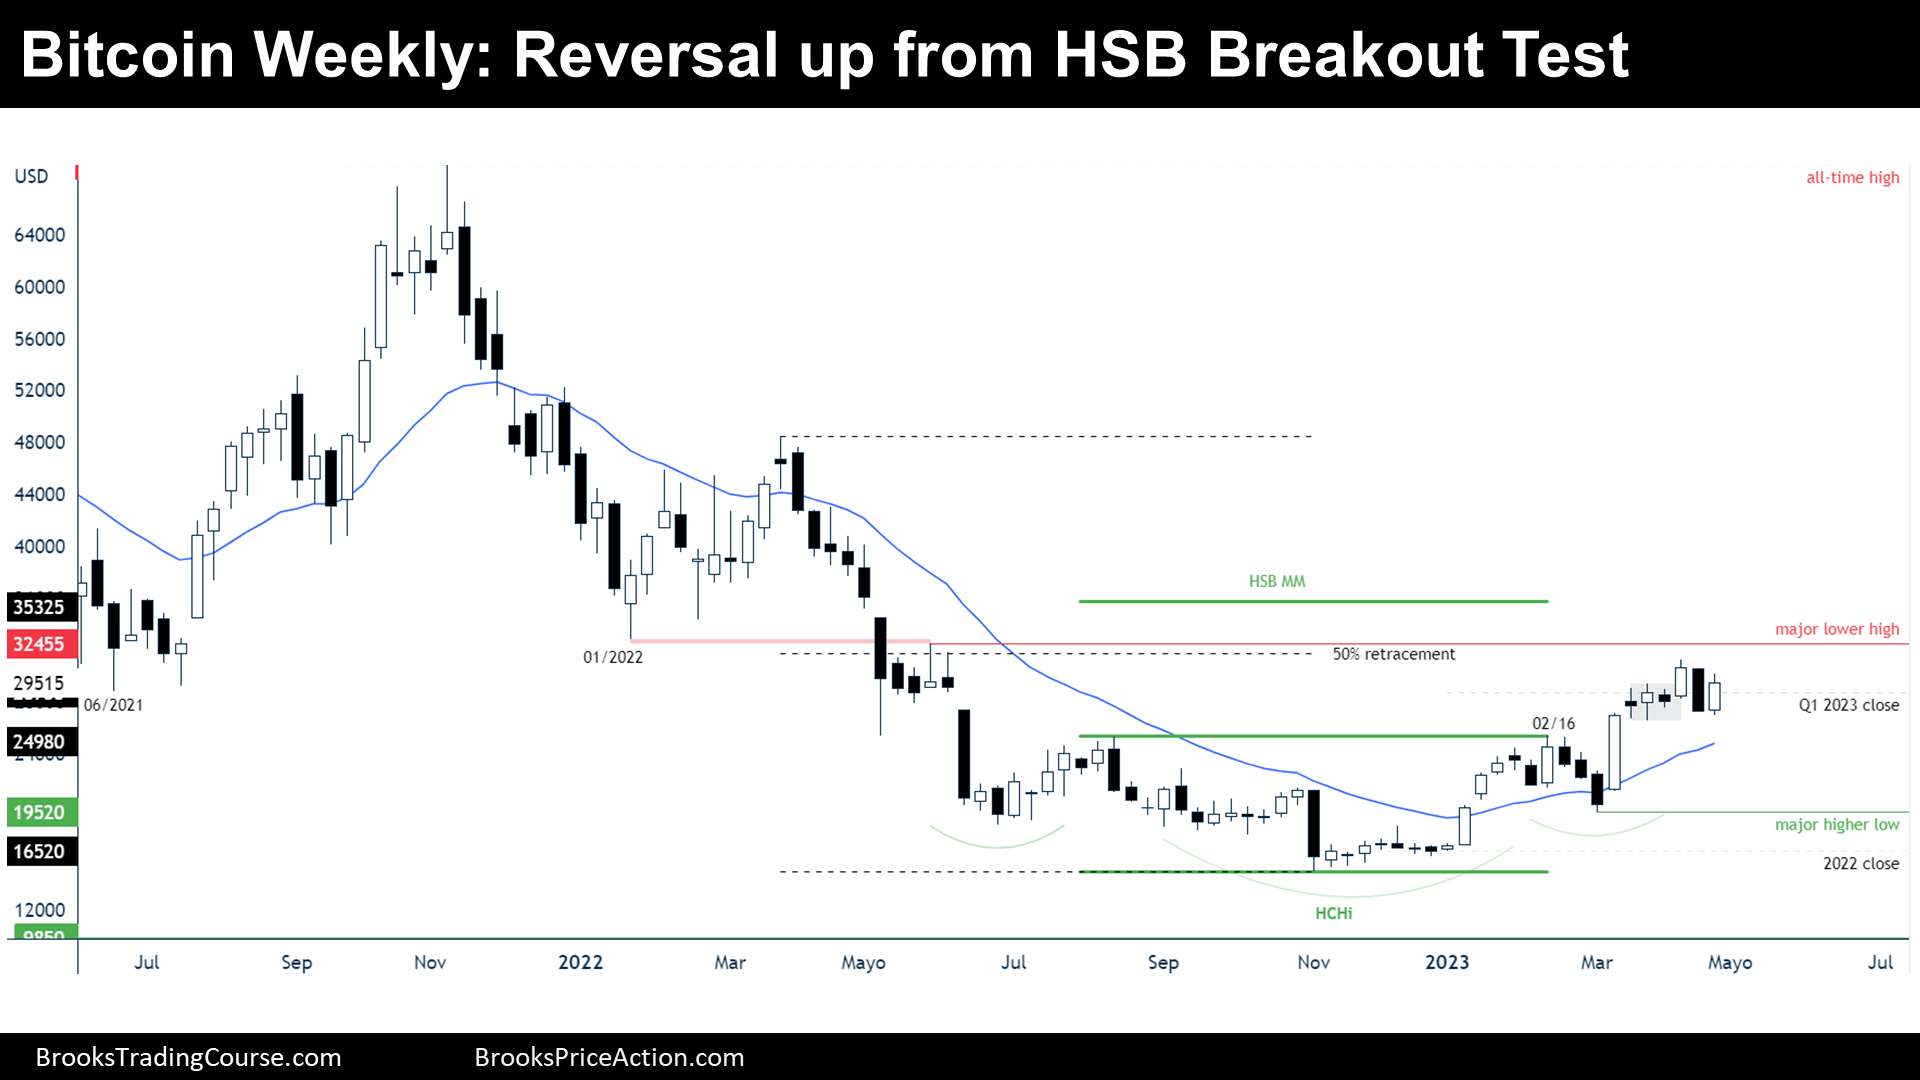
The Weekly chart of Bitcoin futures

Analysis
- This week’s candlestick is a bull bar that follows a strong bear breakout bar. It is poor follow through for bears who sold below last week’s low.
- The bears could not trigger the sell of a “failed inside-outside-inside (ioi)” setup, since the price did not trade below the outside bar of the ioi.
- Moreover, the price was testing the Head and Shoulders Bottom (HSB) high, at the February 16th high, after its breakout. Bears did not close the gap between the price and the HSB high and now, bulls might get a new high while managing to keep important gaps open, a sign of a strength. That will happen if the price trades above April’s high.
- Traders wonder if this is a bull leg in what will become a trading range, or if this bull leg is a small pullback bull trend.
- If the price goes above April without closing the April’s high gap, it will increase the chance of this being a small pullback bull trend; but it won’t be easy since traders would evaluate the price action at around the 50% retracement, where many traders will be ready to sell.
- Nowadays, the different participant’s perspective might look something like this:
- Bulls:
- Their minimum goal is getting to the major lower high and close the gap between the price and the January 2022 low. That would mean that all the traders that bought below the January Low and scaled in, made money; hence, bulls will buy again below lows.
- They want to get to the Measured Move up from the Head and Shoulders Bottom pattern.
- Ultimately, they want a small pullback bull trend that gets to the monthly’s major lower high.
- Bears:
- A bear leg will start at some point, and they wish that this might happen soon.
- They would like to avoid new highs this year and close the gap between the price and February’s high.
- They want to avoid the bulls getting to the major lower high because that will end, technically, their bear trend thesis.
- If a bear leg down starts, the minimum goal is getting to the major higher low.
- Bulls:
Trading
- Bulls:
- The current bar is a high 1 buy and a bull bar, so there might be reasonable buyers buying above the current bar. The problem is that there are resistances just above and then, if they buy it is because they will be able to use wide stops and scale in lower.
- Bears:
- They can still sell below the “ioi” for a “failed ioi” sell setup.
- Their target would be the major higher low, and the stop loss at the major lower high.
Market analysis reports archive
You can access all weekend reports on the Market Analysis page.

