Market Overview: Bitcoin
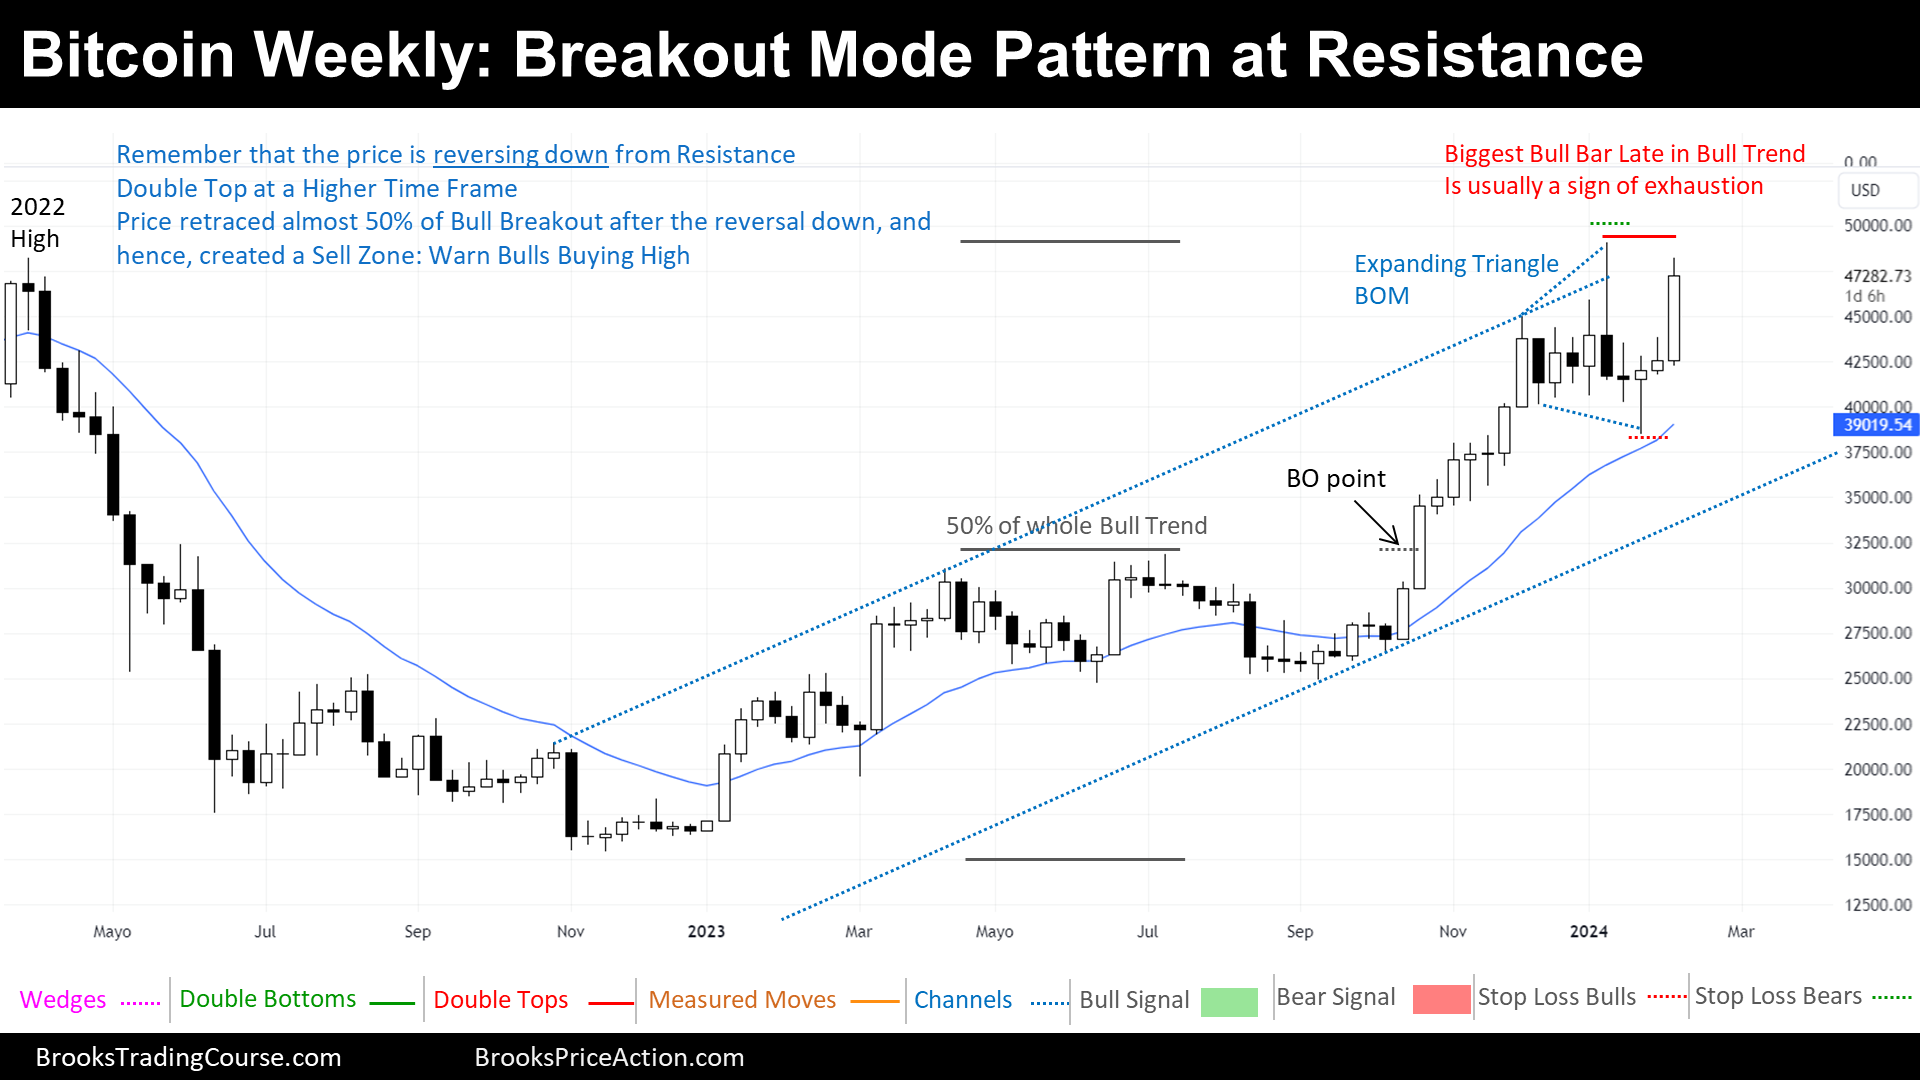
In previous editions of the Bitcoin Weekly Report, we anticipated the possibility of another leg down in the market. However, this week we might have seen a significant shift in dynamics with the emergence of a strong Bull Breakout Bar. Presently, the price appears to be within a small Expanding Triangle on the weekly chart, which means that we are within a Breakout Mode Pattern.
How much this alteration impact our previous assessment of market direction? To find out, let’s delve deeper into the analysis.
Bitcoin
The prices depicted on our charts are sourced from Coinbase’s Exchange Spot Price. It’s crucial to note that the spot price of Bitcoin is continuously in motion; trading activity never ceases. This means that market fluctuations and price changes occur around the clock, reflecting the dynamic nature of cryptocurrency trading.
The Weekly chart of Bitcoin

The price has once again approached the highs of both 2022 and the current year. Concurrently, we find ourselves positioned at the upper boundary of a bullish channel, indicating the prevailing trend.
However, the presence of significant sideways trading suggests a transition from a Bull Breakout phase to a period of consolidation, highlighted by the price stalling at the 2022 high resistance and retracing nearly 50% of the entire bull breakout: the market’s recent performance mirrors a trading range rather than a bull trend cycle. In such a scenario, traders typically engage in buying at lower levels and selling at higher levels.
It’s worth noting that while the current bull breakout bar appears strong, its late occurrence diminishes the likelihood of a sustained directional continuation. Moreover, the market finds itself within a small range, resembling a small expanding triangle, indicative of a Breakout Mode Pattern.
Given the resistance levels, such as the 2022 high and the upper boundary of the bull channel, bulls are unlikely to initiate buying above the breakout mode pattern high. Instead, a failed Bear Breakout of the Breakout Mode Pattern or other strategic entry points may present more favorable opportunities.
Conversely, bears identify multiple entry possibilities, including the potential for a Low 2 setup with a Double Top formation at the 2022 and 2024 highs. Additionally, utilizing limit orders above the Breakout Mode pattern might be a viable strategy, albeit with increased risk, since this late strategy would require strong trade management skills.
In conclusion, the most probable scenario remains sideways or sideways to downward trading, given the current resistance levels. However, a shift in market dynamics, particularly with bears failing above resistances, could necessitate a reassessment of our analysis.
The Daily chart of Bitcoin

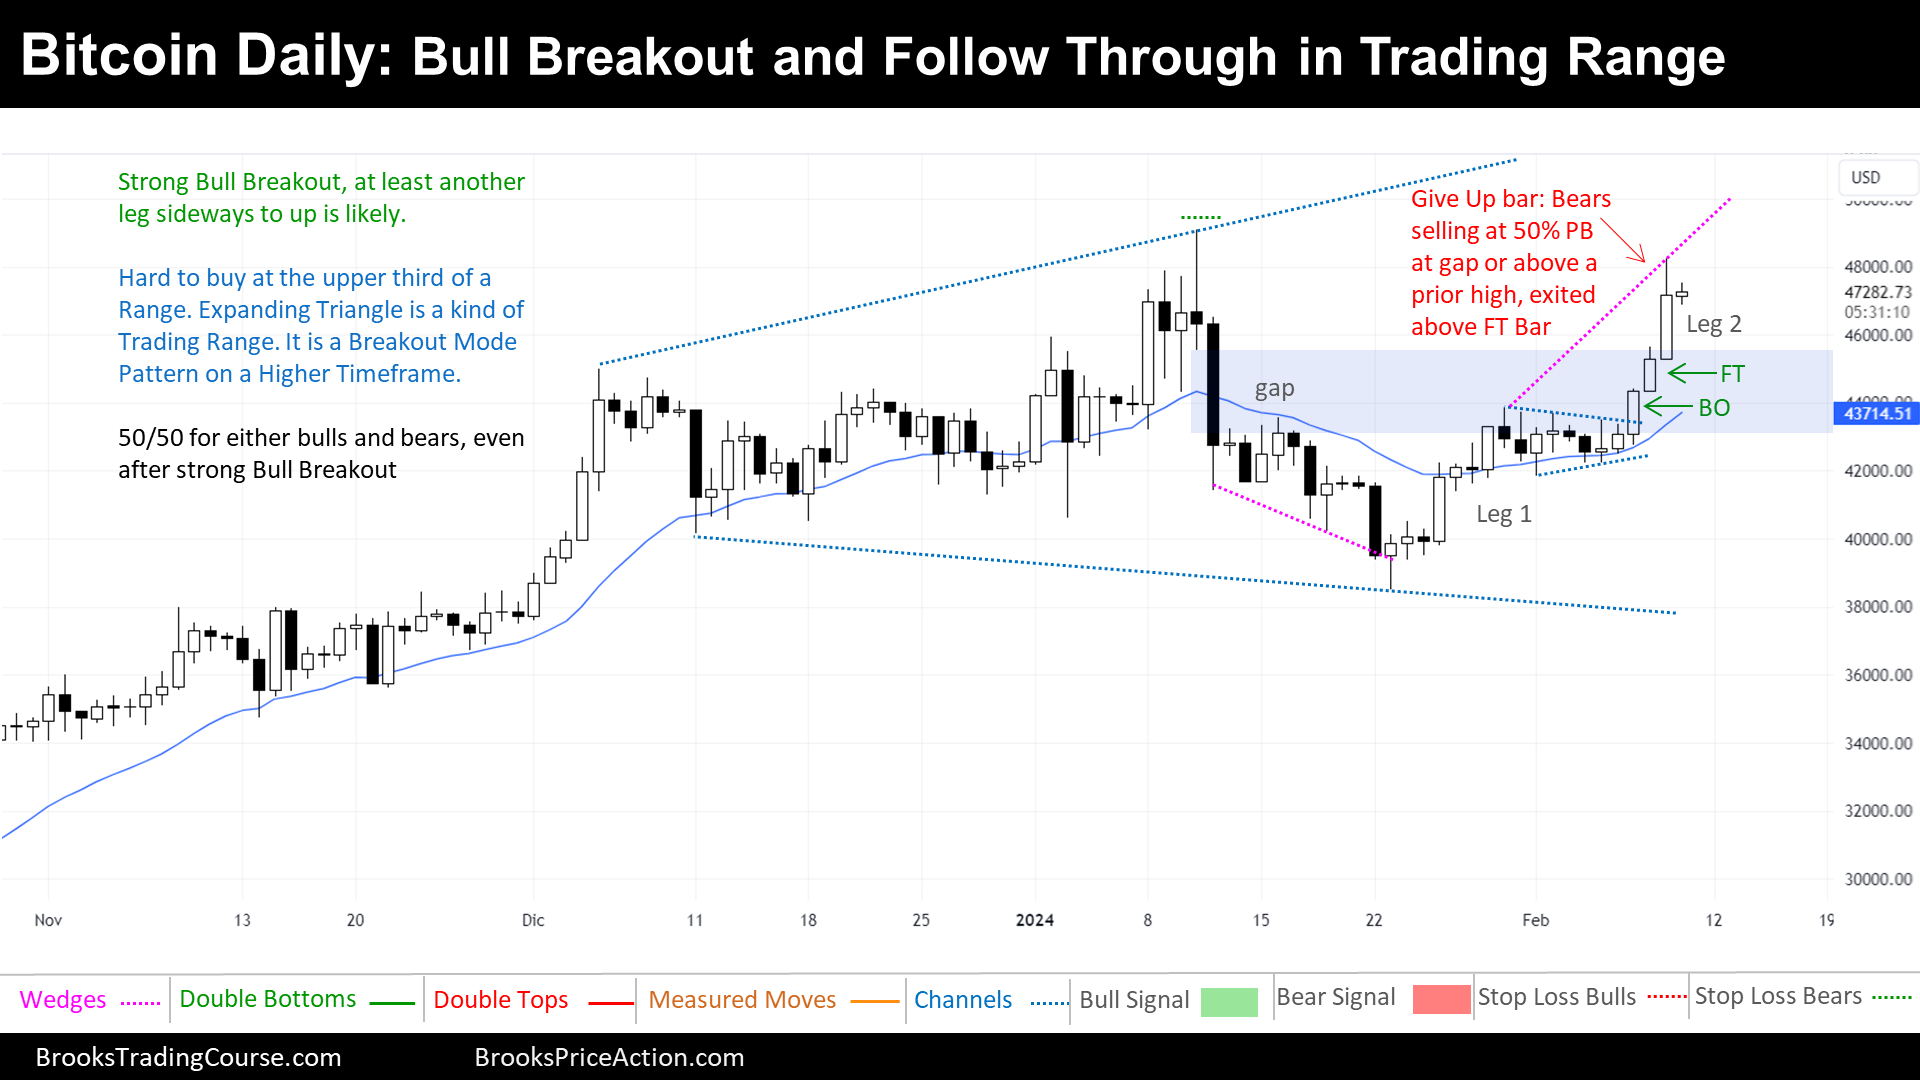
This week witnessed a robust Bull Breakout (BO), initiated by a break above a small Bull Flag, which is a Breakout Mode pattern. Bears initially entered the market selling, since there was a bearish gap and the 50% resistance after a tight bear channel. However, their positions quickly soured after the Bull Breakout, culminating in a decisive Bull Follow Through Bar (FT). Subsequently, many bears exited their positions, resulting in a notable give-up bar on Friday, with strong bears opting to exit before their stop losses above the high of the trading range are triggered.
As the market assesses its next move, bulls contemplate the possibility of a spike and channel bull trend. However, considering this being at the second bull leg and the price’s position at the upper third of the trading range, the probability diminishes for such a scenario. Consequently, the likelihood of a reversal gains prominence, prompting speculation about whether it will originate from a new high or within the trading range.
Expectations suggest a test of Friday’s high. Should sufficient open interest (plenty of orders resting there) exist above the current 2024 high, the price may ascend there. Conversely, bears eye the opportunity to fade the Bull Breakout, viewing it as a potential Bull Climax. However, they exercise caution, awaiting the formation of a micro double top or another reversal pattern before initiating selling positions.
In conclusion, the market cycle currently aligns with a trading range, with bulls maintaining momentum. However, caution is advised for buyers operating at the upper third of the range, while bears await clear reversal signals before entering the market.
We invite you to share your thoughts and analysis in the comments below. What do you make of the recent developments? Are you bullish or bearish on Bitcoin’s future trajectory? Let’s continue this conversation and collectively deepen our understanding of the market.
Additionally, if you find the Blog Reports insightful, consider sharing it with your network. By spreading knowledge and insights, we can empower more individuals to make informed decisions thanks to Al Brooks’s teachings. Thank you for your engagement and contribution to our community. Let’s keep learning and growing together.
Josep Capo
Market analysis reports archive
You can access all the weekend reports on the Market Analysis page.

