Market Overview: Bitcoin
Next Wednesday marks the close of Bitcoin’s Monthly Bar, a crucial event for market observers. January holds significance among institutions, often serving as a barometer for the year ahead. Presently, Bitcoin exhibits a large doji bar on the monthly chart, characterized by its open positioned below the midpoint. Looking ahead, traders anticipate sideways to upward trading following the formation of an Expanding Triangle Pattern on the Daily Chart. The pressing question remains: Will the Bears discover catalysts to reignite the reversal down towards the 50% mark of the Bull Trend?
Bitcoin
The prices depicted on our charts are sourced from Coinbase’s Exchange Spot Price. It’s crucial to note that the spot price of Bitcoin is continuously in motion; trading activity never ceases. This means that market fluctuations and price changes occur around the clock, reflecting the dynamic nature of cryptocurrency trading.
The Weekly chart of Bitcoin

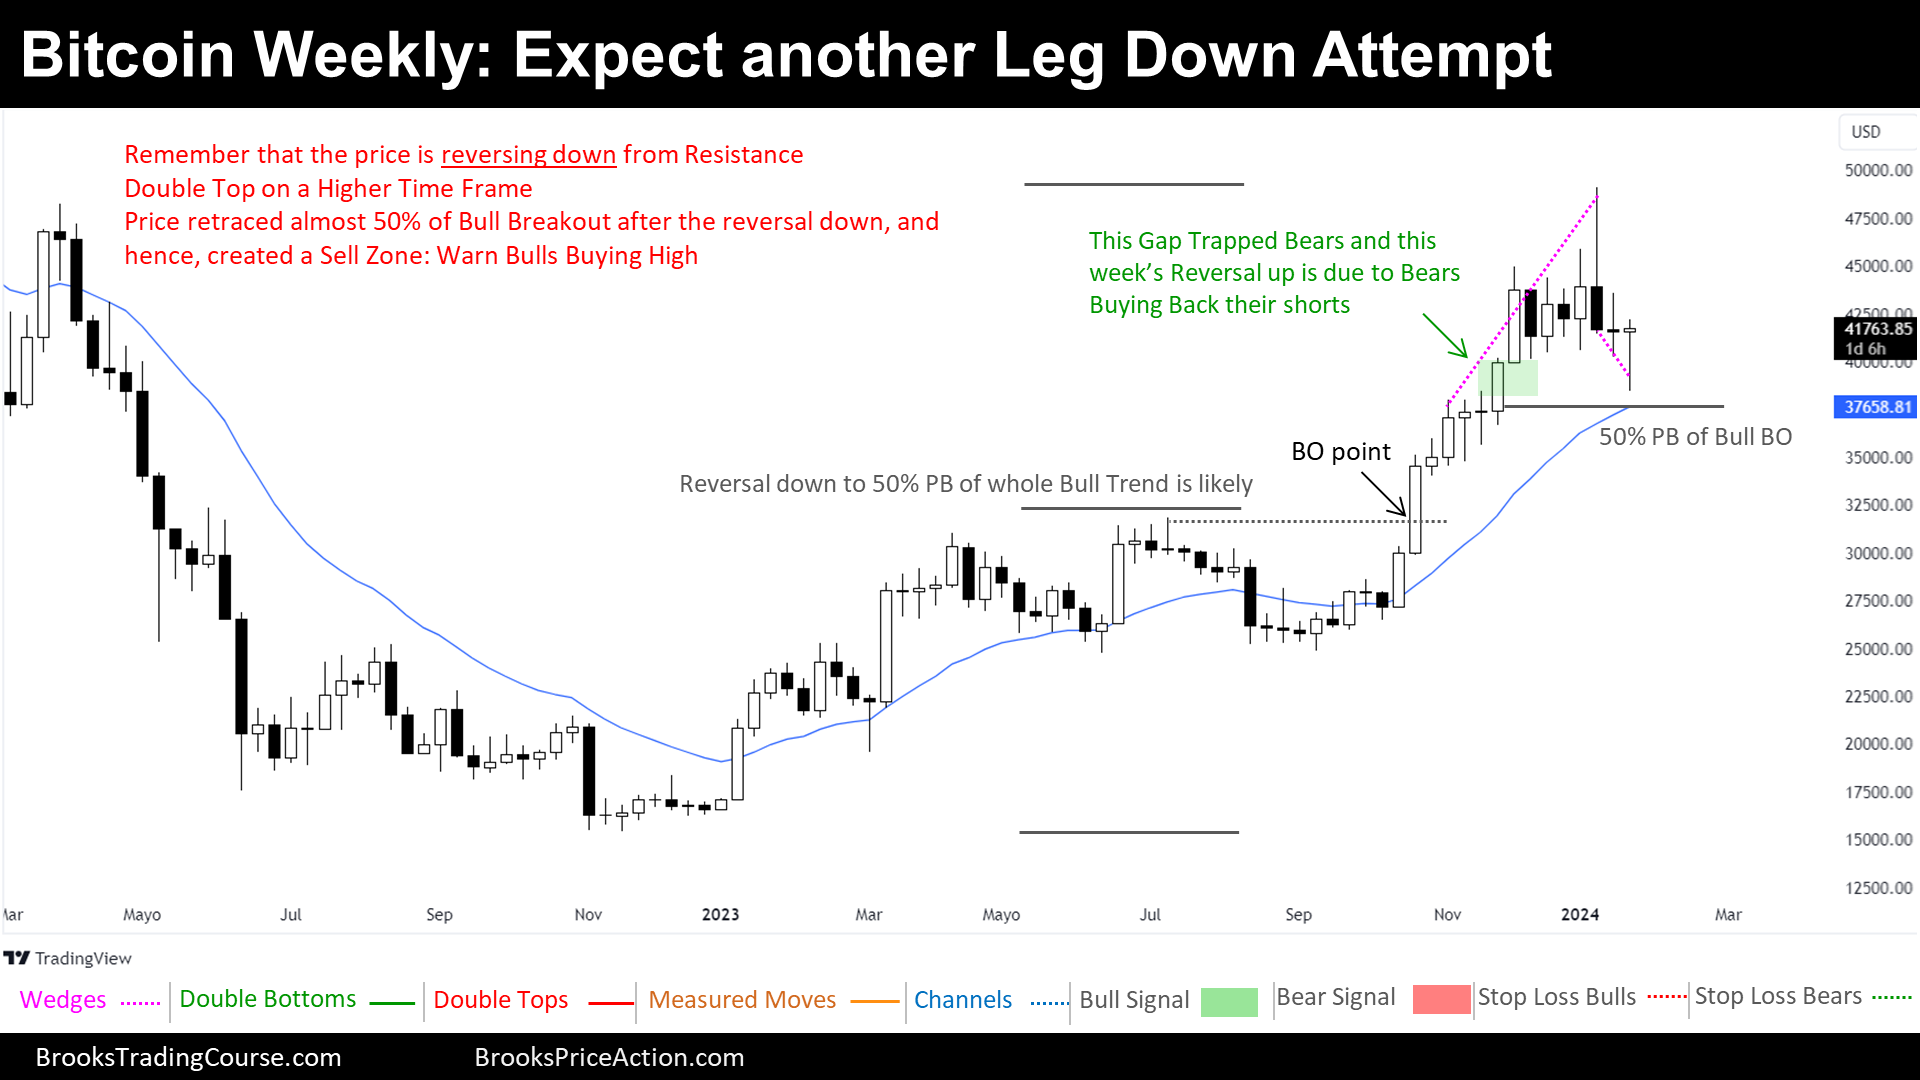
In the analysis of the weekly chart, several key observations emerge. Firstly, there is a discernible reversal down from the 2022 high Resistance Level, indicative of significant market dynamics. This is compounded by the observation that the current price resides within a Sell Zone, an area historically associated with the accumulation of bearish orders preceding the 2022 Bear Breakout and subsequent trend.
Moreover, the logical support levels in this context are identified as the Breakout Point and the 50% Pullback of the 2023 Bull Trend, serving as crucial reference points for traders navigating market movements. Examining the higher timeframe reveals a potential Double Top formation, further reinforcing the notion of a market within a defined Range, a Trading Range Market Cycle.
Additionally, the formation of a Parabolic Wedge Top preceding the reversal from the 2022 Resistance underscores the complexity of current market dynamics. Traders anticipate a period of sideways to downward movement following this reversal, with the possibility of multiple legs down in the near future.
Looking ahead, traders anticipate another leg down towards the 50% Pullback, driven by several factors. The concept of the Fair Price, situated at the midpoint of the Trading Range, suggests equilibrium between bullish and bearish interests. Furthermore, the challenge of finding incentives for bulls to buy at resistance and within the Sell Zone reinforces expectations of further downward movement.
In conclusion, the current market conditions present challenges for buyers within the Sell Zone, with bears strategically positioning themselves for potential entry points. Traders remain vigilant for setups such as the Micro Double Top or Lower High (Low 2/3 setup), signaling potential opportunities amidst market volatility.
The Daily chart of Bitcoin

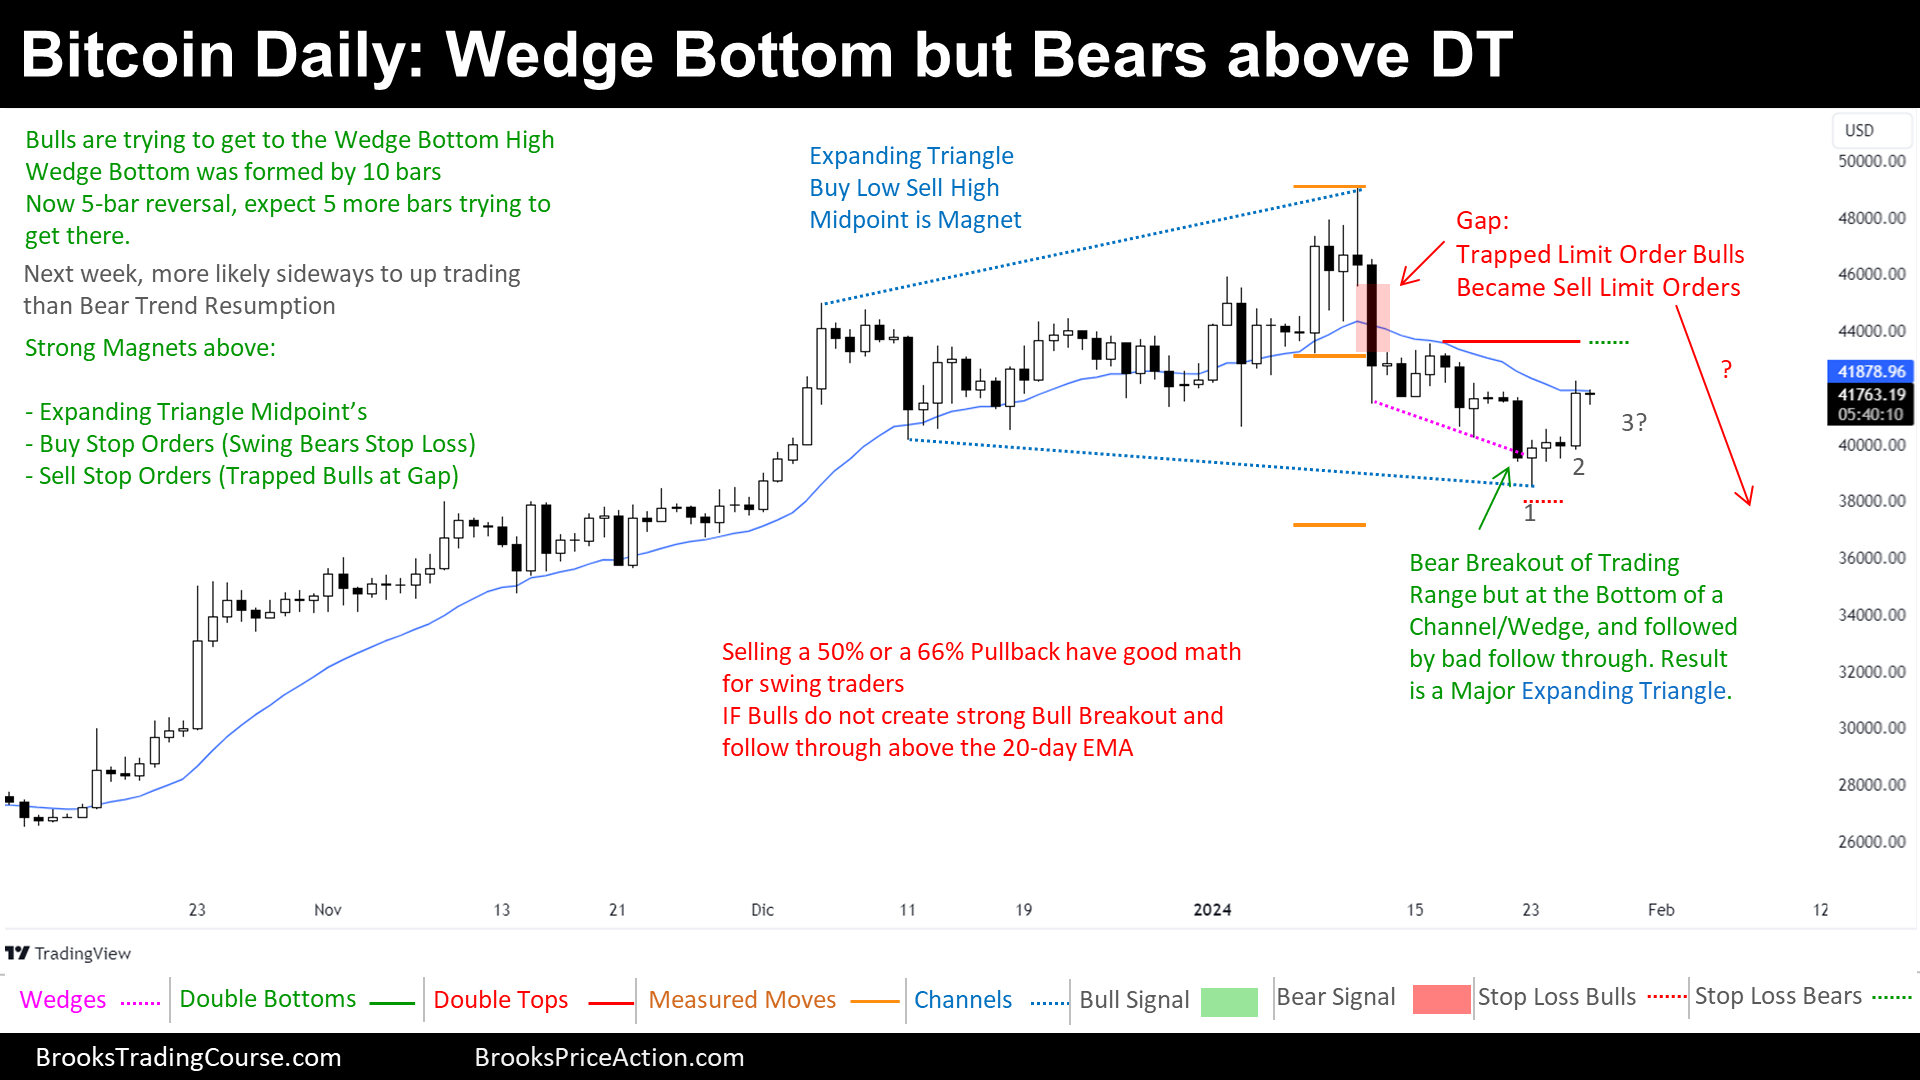
On the Daily Chart Analysis, the price recently attempted a Bear Breakout of the Trading Range but encountered support at the Bottom of the Bear Channel, which is the Bottom of a Wedge Bottom pattern. This location increased the likelihood of a Failing Bear Breakout scenario.
Then, the price reversed upwards and created a visible Trading Range Pattern known as an Expanding Triangle. Within any Trading Range Pattern, the midpoint serves as a magnet, with a Buy Zone below and a Sell Zone above.
Currently, the price is reversing up from the Wedge Bottom, with the wedge being formed over 10 bars. Traders anticipate approximately 10 bars of sideways to upward trading towards the Wedge Bottom High. With 5 bars having elapsed, expectations lean towards continued sideways to upward movement at least until month-end.
Despite facing resistance from the 20-day Exponential Moving Average (EMA), there are indications of potential upward movement. Dormant orders exist above the current price level, originating from Trapped Bulls (evidenced by a Bear Gap) and the Stop Losses of Bears who sold during the Bear Channel. These orders are primarily in the form of Sell Limit Orders and Buy Stop Orders, respectively.
In conclusion, current indications suggest a potential for upward price action in the short term. Traders may find opportunities to sell above the mid-point of the Expansive Triangle, given the presence of dormant orders and the ongoing pattern formations. However, careful monitoring of price behavior is advisable to capitalize on potential trading opportunities.
Join the conversation and share your insights in the comments below! Your feedback and perspectives enrich our community. Don’t forget to share this post with fellow traders who might benefit from the analysis. Together, let’s navigate the complexities of the market and uncover opportunities.
Josep Capo
Market analysis reports archive
You can access all the weekend reports on the Market Analysis page.

