Market Overview: Bitcoin Futures
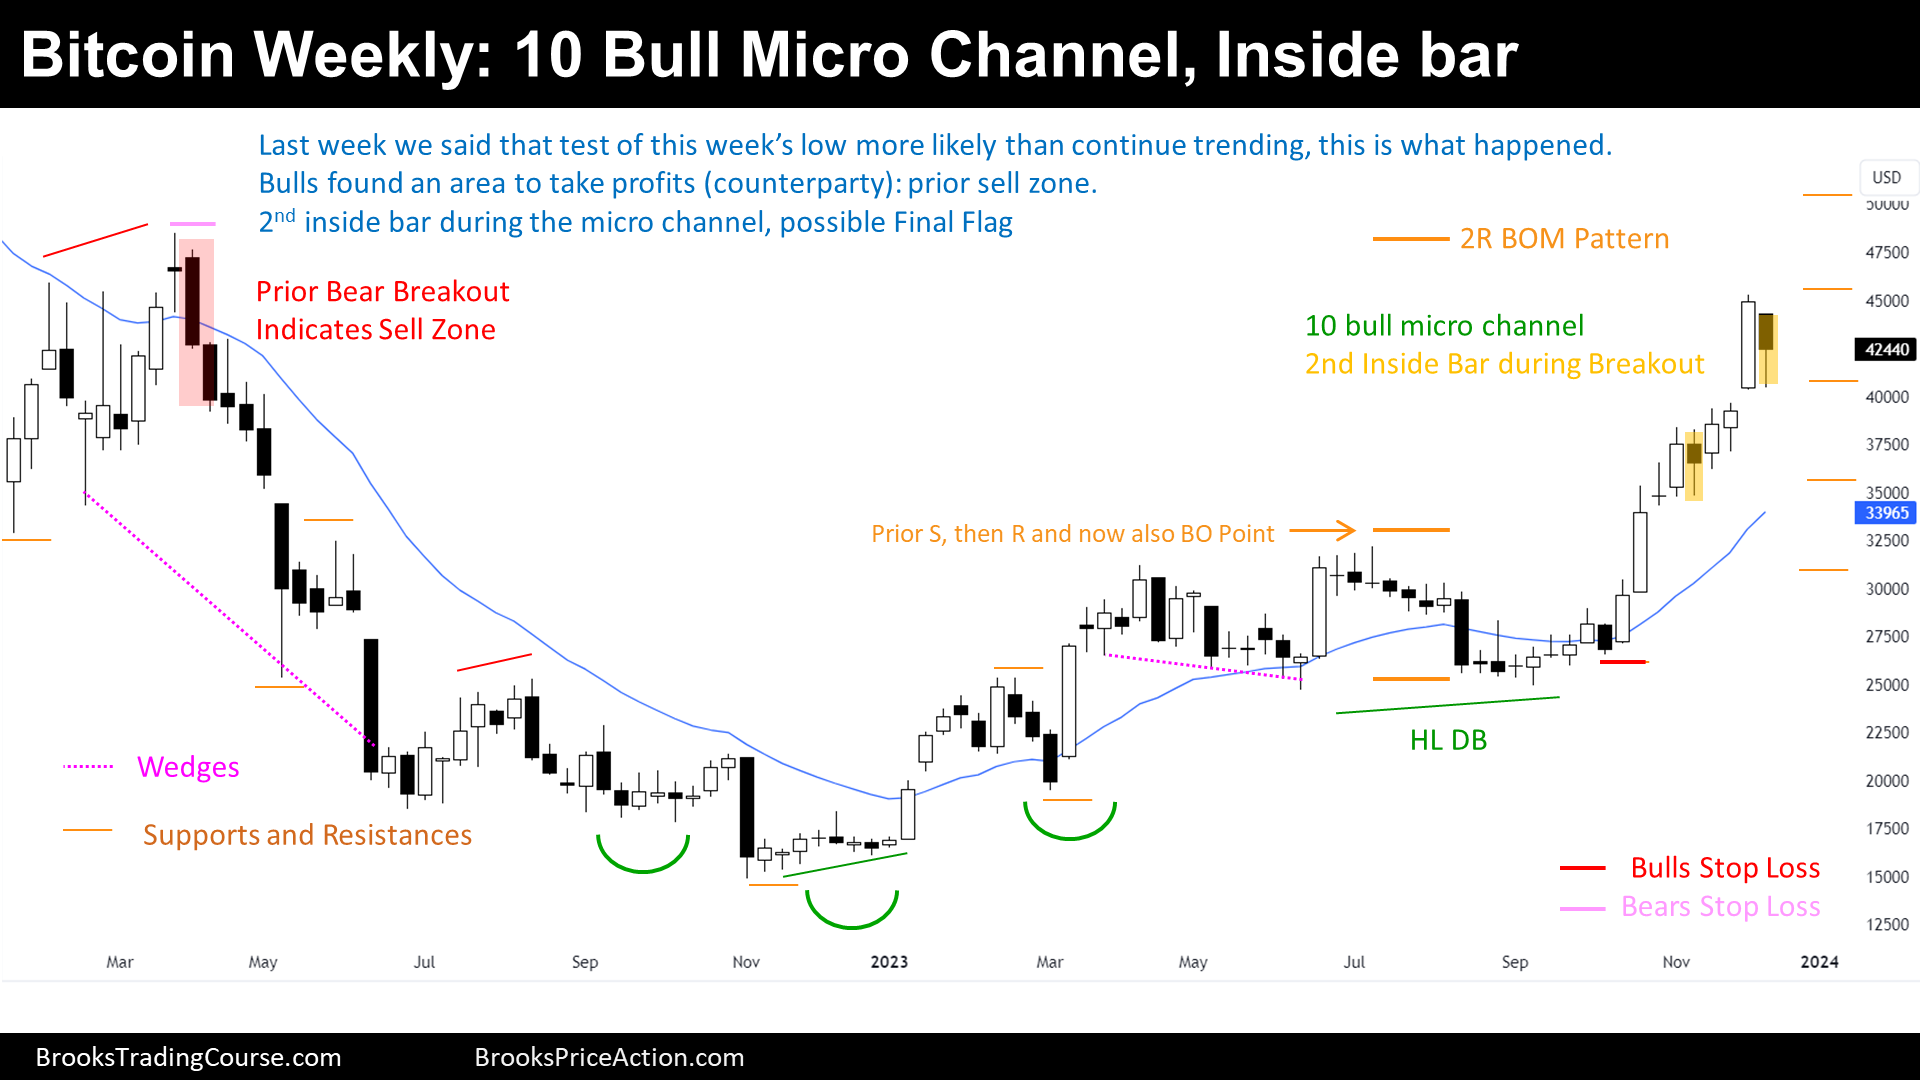
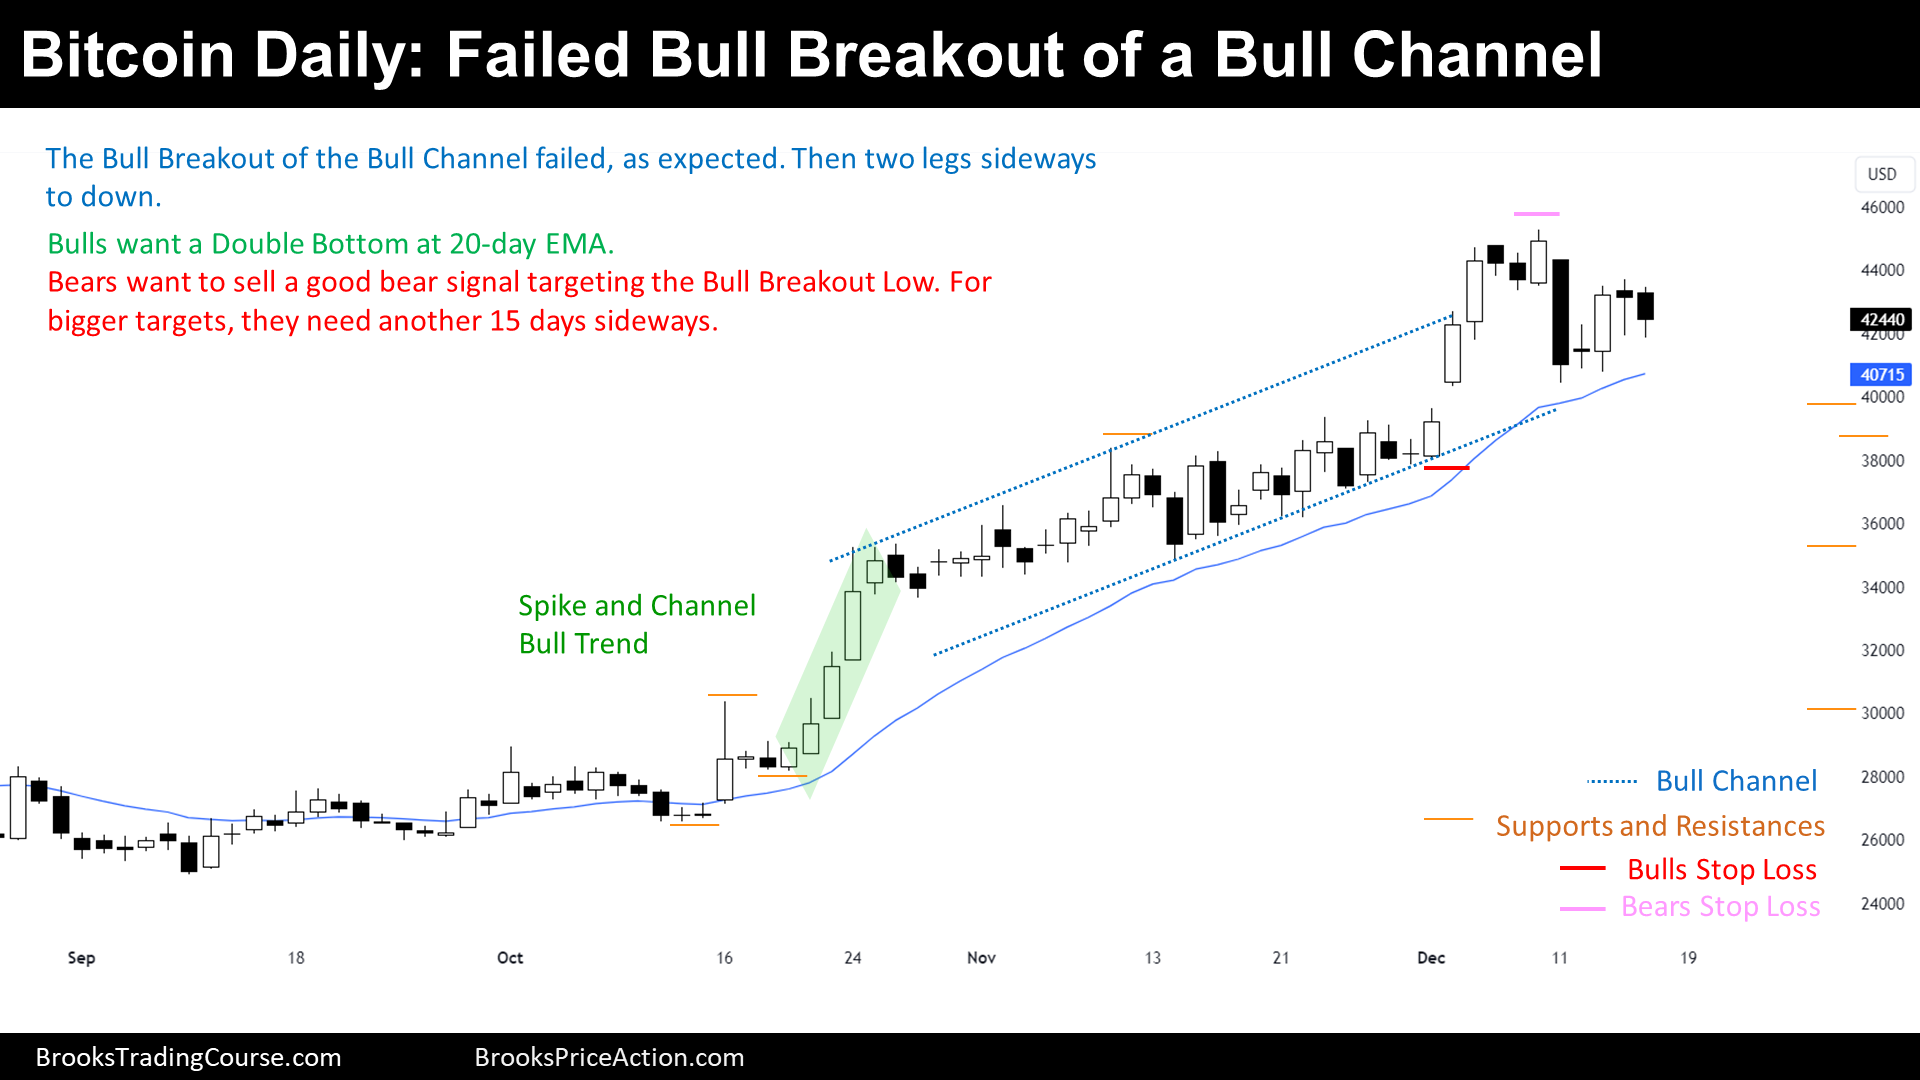
Bitcoin 2nd inside bar of a 10-week Bull Micro Channel. Last week, we have said that the price was likely to test this week’s low instead of continuing to trend up higher, and this is what happened. This sell-off was provoked by Bulls taking profits, since there is not any topping pattern yet. Regarding the Daily chart, the price failed to do a Bull Breakout of a Bull Channel. Moreover, last week, we have said that the chances of a successful Bull Breakout of a Bull Channel only happens 30% of the time.
Bitcoin futures
The Weekly chart of Bitcoin futures

Mapping Orders
- Bulls:
- Their Stop Loss is likely below the 10-bar Bull Micro Channel low.
- Bull’s Stop Loss are “Sell at the Market” orders.
- Their Stop Loss is likely below the 10-bar Bull Micro Channel low.
- Bears:
- If there are weekly Bears, their Stop Loss is most likely above the 2022’s high.
- Bear’s Stop Loss are “Buy at the Market” orders.
- If there are weekly Bears, their Stop Loss is most likely above the 2022’s high.
Market Cycle
- The Market Cycle looks like a Bull Breakout:
- During a Bull Breakout, Traders buy High.
- But this week, after a good Bull Breakout Bar, the price reversed down.
- Traders are not buying high anymore.
- If the Bull Breakout is over, ¿what is this?
- The Spike of a Spike and Channel Bull Trend.
- Or a Bull Leg of a Broad Bull Channel.
- Or a Bull Leg into a Trading Range.
- ¿What is more likely?
- Judging on higher Time Frames, a Trading Range is more likely.
- The price is still within the 2022’s price range.
- 2023 is an Inside Bar on the Yearly Chart.
- An Inside Bar represents a Trading Range pattern.
- A Trading Range pattern can be a continuation pattern or reversal pattern.
- The price was coming from a +75% drawdown, and hence, the prior context was not bullish.
- Reversal pattern likely.
- The price was coming from a +75% drawdown, and hence, the prior context was not bullish.
- A Trading Range pattern can be a continuation pattern or reversal pattern.
- An Inside Bar represents a Trading Range pattern.
- 2023 is an Inside Bar on the Yearly Chart.
- The price is still within the 2022’s price range.
- Judging on higher Time Frames, a Trading Range is more likely.
- The Bull Breakout is probably a Bull Leg in a Trading Range.
Inertia
- Traders expect a reversal.
- Since this is likely just a Bull Leg in a Trading Range.
- After a Bull Leg in a Trading Range, comes a Bear Leg.
- Since this is likely just a Bull Leg in a Trading Range.
- Bulls are taking profits, but if there are not enough Bears willing to sell around this area, the price might vacuum test the Bear’s Stop Loss to find its counterparty.
- Until there is not a Bear Sell Setup, more likely trading towards Bear’s Stop Loss.
- If there is another push-up, the price will draw a Parabolic Wedge Top and the odds of a reversal will increase.
Trading
- Bulls:
- They are not likely to buy high.
- More likely, they are taking profits.
- Their risk is too big if they maintain the original Stop Loss:
- They probably took partial profits along the way and have their Stop Loss above their entry price:
- The Breakout Mode Pattern High.
- Above the high of the Bull Breakout Bar that broke the Breakout Mode Pattern.
- They probably took partial profits along the way and have their Stop Loss above their entry price:
- Their risk is too big if they maintain the original Stop Loss:
- Bears:
- They might sell after a Bear Signal Bar.
- Either after a Micro Double Top from this week.
- After a Parabolic Wedge Top formation.
- After a Low 2 sell Signal.
- They might sell after a Bear Signal Bar.
The Daily chart of Bitcoin futures

Bulls and Bears Map
- Bulls:
- Their Stop Loss is below the Bull Breakout Low.
- Bull’s Stop Loss are “Sell at the Market” orders.
- Their Stop Loss is below the Bull Breakout Low.
- Bears:
- Their Stop Loss is above December high.
- Bear’s Stop Loss are “Buy at the Market” orders.
- Their Stop Loss is above December high.
Market Cycle
- The market cycle is a Small Pullback Bull Trend.
- The Small Pullback Bull Trend is also a Spike and Channel Bull Trend.
- The Trend has been so strong that the price did not touch the 20-day Exponential Moving Average since the Bull Spike.
- But a strong Bull Breakout occurred late in the Bull Trend, and now the price is forming a second leg sideways to down.
- Eventually, the price will probably transition into a Trading Range.
- First, the price needs to take out the Bulls by Trading at the Bull’s Stop Loss.
- Or trade sideways for about 15 bars more.
Trading
Until there is not a Bear Signal on the Weekly or Monthly, or until the Bulls are not proven wrong by transitioning into another Market Cycle, swing Traders should look to buy.
- Bulls:
- Bulls that were in the Trade, probably took most of their profits during the past Bull Breakout, or they will exit below a Bear Bar.
- Most want to buy a reversal up from the 20-day Exponential Moving Average.
- Last week, we have said that Bulls would take profits below a Bear Signal or a Low 2.
- Bears:
- Bears selling now have a low probability of success. They need a Low 2, Low 3, or better, wait for a Major Trend Reversal Setup.
Market analysis reports archive
You can access all the weekend reports on the Market Analysis page.

