Monthly S&P500 Emini futures candlestick chart:
3 month bull flag
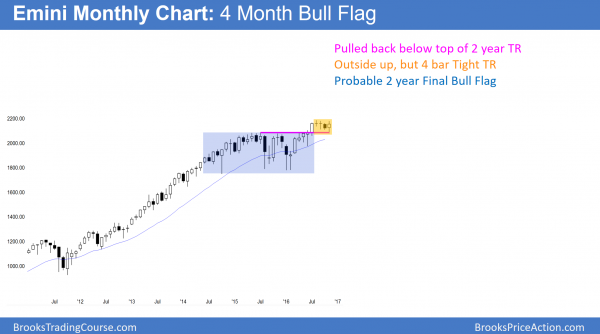
The monthly S&P500 Emini futures candlestick chart formed an outside up month after a 3 month pullback. Because there is a 4 bar tight trading range, it might continue sideways for another month or two.
The monthly S&P500 Emini futures candlestick chart has pulled back for 3 months since the August high. I said in August that August was the 7th consecutive bull trend bar on the monthly chart. In addition, there have never been 8 consecutive bull bars since the Emini began 18 years ago. Furthermore, after every time there were 7, the Emini corrected down about 100 points. I therefore said that the Emini was likely to pull back for about 100 points. It did this week.
Since 7 consecutive bull bars is a sign of strength, I said that the bulls would buy the 100 point pullback. They therefore saw the selloff as a bull flag instead of a bear trend reversal.
Closure of gap above July 2015 trading range
The Emini went sideways for about 4 months. During that time, I said that the gap above the top of the 2 year trading range had a 70% chance of closing. There, the strong July breakout above the range was more likely an exhaustion gap than a measuring gap. Because of that, I said that if the bulls broke to a new high, it would probably soon fail. This is because the magnetic pull of the July 2015 high was strong. The bulls were unlikely to be able to escape its pull.
Since there were probably sellers above the July to October trading range and buyers below the July 2015 high, traders could fade whichever came first. As a result, bulls bought below the July 2015 high, expecting the current rally to go to a new all-time high. While the Emini rallied strongly this week, there is still room to the all-time high of 2185.00.
Major reversal after new all-time high
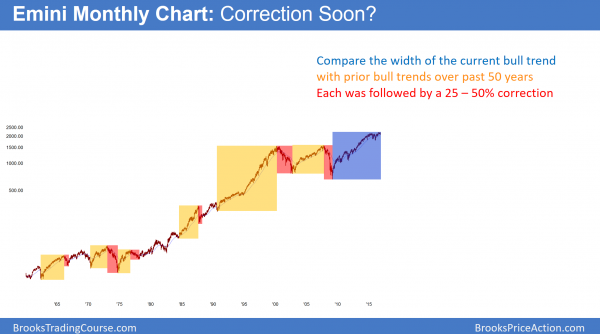
The rally has lasted 7 years on the monthly chart. There have been many other rallies in the past 50 years that have lasted 5 – 7 years. Each one was followed by a 25 – 50% correction of the rally. Therefore the same is likely this time.
How long can last week’s rally last if it leads to a new high? Maybe 5 – 10 bars. Since this is a monthly chart, that means the current rally might last all of 2017. Yet, the 2 year trading range will probably be the Final Bull Flag.
The bull trend began in March 2009 at 473.50. The current high is about 2100. That is about a 1600 point rally. A 50% correction would be 800 points. That is probably too much. However, a 25% correction would be 400 points. That would take the Emini down to 1700. It would therefore be below the 1800 low of the 2 year trading range.
In the current bull trend, the Emini broke above a double top at around 1500. Those highs were in 2000 and 2007. That is therefore a support area. If there is a repricing of the Emini, which is likely, that would be a logical magnet.
The importance of the bond market
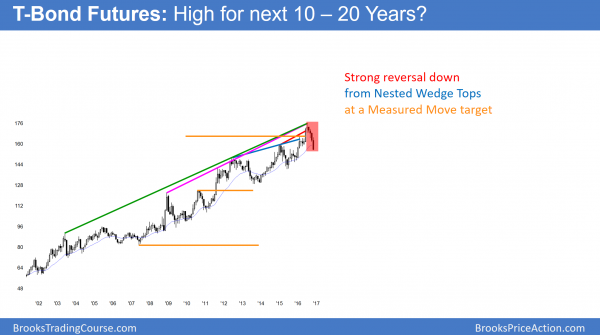
The 30 year bond futures chart is reversing down from a nested wedge top on the monthly chart. This chart shows 15 years of a 30 year rally.
As a result of the nested wedge tops, this is probably the end of the 30 year bull trend. Therefore, interest rates will probably continue to rise for 10 – 20 years. Because of this, investors will begin to get good returns from CDs and other low risk interest rate investments. They therefore will transfer some of their portfolio from stocks to these safer alternatives. This selling of stocks will contribute to the stock market repricing.
Weekly S&P500 Emini futures candlestick chart:
Strong bull breakout above a High 2 bull flag
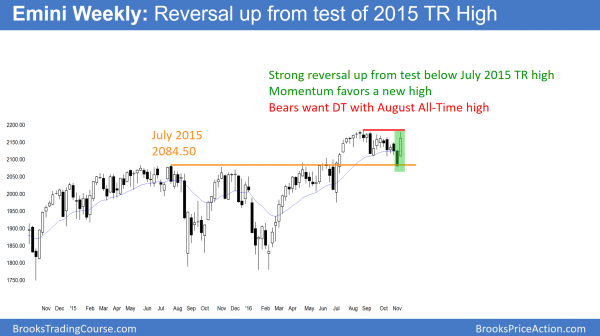
The weekly S&P500 Emini futures candlestick chart dipped below the July 2015 high at the top of a 2 year trading range. After closing that gap, it reversed up strongly this week.
The weekly S&P500 Emini futures candlestick chart reversed up strongly this week after last week’s strong bear breakout. The bulls saw the selloff from the August all-time high as a big High 2 bull flag. Yet, this week’s candlestick had a big tail on top. Because it is stalling at the all-time high, it might go sideways for a week or two before breaking to a new high. Since the reversal up was so strong, the odds favor a new all-time high soon.
The bears want this sharp rally to be a bull trap that creates a double top with the August all-time high. While this is possible, it is not likely. Yet, if the bears can prevent a new all-time high for several weeks, they could create a micro double top. This would increase the probability of a reversal down. Until there is a micro double top, the odds favor sideways to up over the next few weeks.
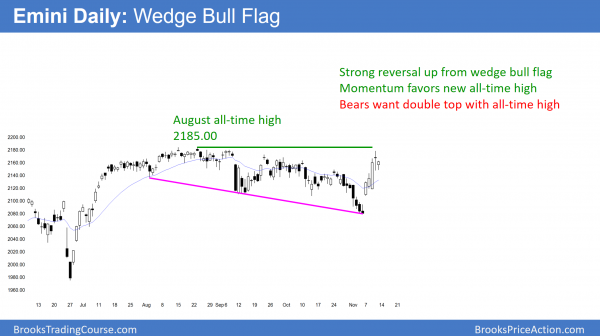
Daily S&P500 Emini futures candlestick chart:
Buy climax and test of the all-time high
The daily S&P500 Emini futures candlestick chart had huge bars this week, but was unable to break to a new all-time high. The bulls are exhausted. They therefore might need more bars before they begin to buy again. The bears want a double top with the August high.
The daily S&P500 Emini futures candlestick chart had a climactic reversal up this week. Yet, it failed to break above the 4 month trading range to a new all-time high. Since the rally covered 100 points in one week, which is unusual, the bulls are probably exhausted. As a result, many take partial windfall profits. Hence, they want to see if the bears can create a double top with the August all-time high.
Bull flag formation
If the bears are unable to turn the market down after 2 – 3 attempts, the bulls will conclude that the bears are weak. The bulls therefore buy the 2nd or 3rd reversal back up. Hence, they see the pullback as a High 2 bull flag, or a Triangle, or a Wedge bull flag. This is how these patterns typically form.
Yet, if the bears are able to get a strong bear breakout, the bulls will continue to wait. They want to see the selloff stall at some support level before buying again. Because the rally was so strong, the odds are that the bulls will buy the 1st reversal down. Hence, the 1st reversal will probably be minor. It therefore would more likely be a bear leg in a trading range than the start of a bear trend.
Traders can see the end of the day bar-by-bar price action report by signing up for free at BrooksPriceAction.com. I talk about the detailed Emini price action real-time throughout the day in the BrooksPriceAction.com trading room. We offer a 2 day free trial.
When I mention time, it is USA Pacific Standard Time (the Emini day session opens at 6:30 am PST, and closes at 1:15 pm PST). You can read background information on the intraday market reports on the Intraday Market Update page.
