Posted 6:57 a.m.
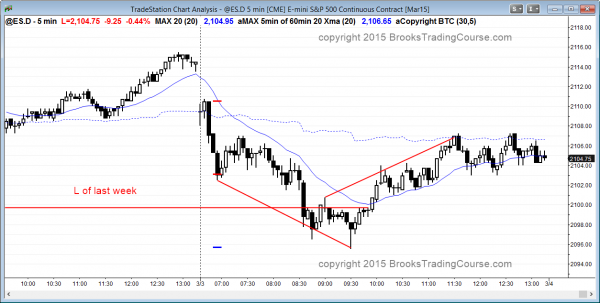
The Emini had a bear opening reversal and it is always in short. Since last week was a sell signal bar and the the Emini is close to the low of last week, the weekly sell signal probably will trigger today. Although, the market might reverse up and not trigger the sell, the odds at this point are that it will. Traders will sell rallies until there is a strong bottom, and they will look to swing at least part of their shorts.
Just because there is a weekly sell signal does not mean that it will lead to a bear trend. It is a weak sell signal bar after 4 bars up. The Emini will probably go more sideways than down for a week or two.
My thoughts before the open: 60 minute wedge top should have an ABC pullback
The 60 minute chart has nested wedge patterns. It had 2 small legs down on Friday, but they might be the first leg of 2 larger legs down. Yesterday’s rally could be a pullback that leads to a larger 2nd leg down.
The bulls want a breakout to a new all-time high, but after the buy climax on the daily chart that ended slightly above a weekly measuring gap target from a year ago, the bulls will probably wait at least a couple of weeks before looking to buy aggressively again. They need to find out just how aggressive the bears will be and they want to give the bears time. After about 10 days, if the bears still have not reversed the market, the bulls who took profits at the new all-time high will buy back their longs and try to get another leg up.
We are still in that 10 day window and the odds are that breakout attempts up and down will fail. This means that the odds favor more days within the tight trading range on the daily chart. Although the 5 minute chart can continue to have swings up and down, they are within a tight trading range on the 60 minute chart and daily chart. Traders learning how to trade the markets have to become comfortable with the reality that every rally becomes a bear flag and every selloff becomes a bull flag. Eventually, there will be a sustained breakout up or down, but I think the upside is limited from here because of the monthly chart’s buy climax.
Summary of today’s price action and what to expect tomorrow
The Emini triggered a weekly sell signal by falling below last week’s low, but it reversed up from a wedge bottom.
On the weekly chart, last week was a sell signal bar, but it was only a doji and it followed a strong rally. This is a weak signal bar and it is in a bad context. The result usually is limited selling and more sideways.
The 60 minute chart has a large wedge top and has been forming lower highs and lows. If the bulls fail to rally above a lower high, they will sell out of their longs, which could create a big bear breakout. Traders need to be ready for this, even though this is unlikely.
The Emini is in a 2 week tight trading range. The 60 minute bulls want trend resumption up and the bears want trend reversal down. Until there is a breakout, there is no breakout, and the strong moves up and down will continue to fail. The odds favor more of the same tomorrow.
See the weekly update for a discussion of the weekly chart and for what to expect going into next week.
Traders can see the end of the day bar-by-bar price action report by signing up for free at BrooksPriceAction.com. I talk about the detailed Emini price action real-time throughout the day in the BrooksPriceAction.com trading room, and a 2 day free trial is available.
When I mention time, it is USA Pacific Standard Time (the Emini day session opens at 6:30 am PST, and closes at 1:15 pm PST). You can read background information on the intraday market reports on the Intraday Market Update page.


