Market Overview: Nifty 50 Futures
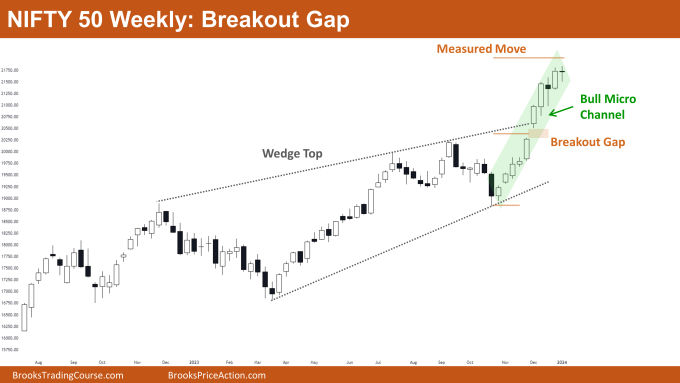
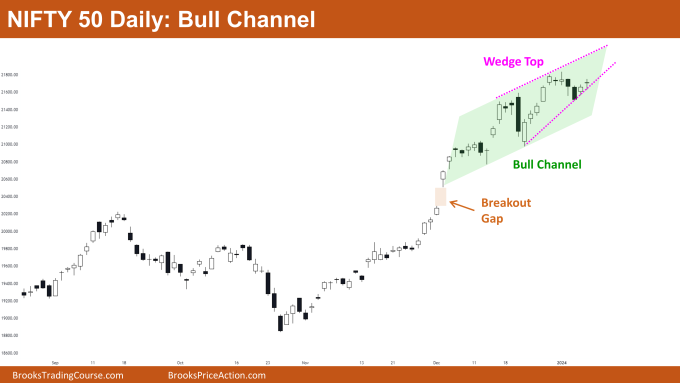
Nifty 50 Breakout Gap on the weekly chart. This week, the market presented a small bear doji bar, yet it continues trading within the Bull Micro Channel. The prospects of a bear reversal remain low as the market sustains a robust bull trend. Despite several attempts, bears have been unsuccessful in reversing the trend. Following the bull breakout of the wedge top, bulls have demonstrated strong follow-through bars, enhancing the likelihood of a successful breakout reaching the measured move target. On the daily chart, Nifty 50 resides within a wedge top and a bull channel, where bear-initiated reversal attempts have faltered to produce significant follow-through, allowing the upward trend to persist.
Nifty 50 futures
The Weekly Nifty 50 chart

- General Discussion
- In the context of a strong bull trend, bears should exercise caution and refrain from selling until they can establish consecutive strong bear bars.
- Bulls holding long positions should maintain their positions as there are no discernible signs of a reversal.
- Traders not currently in a position can consider entering on a high-1 or at the high of the doji bar. This approach aligns with the prevailing strong bull trend, reducing the likelihood of a reversal before a potential second leg up.
- Deeper into the Price Action
- Nifty 50 has formed a breakout gap and is nearing its measured move target.
- The market might exhibit trading range price action in the upcoming week as bulls may opt to book profits near the breakout gap measured move target.
- Despite trading inside a bull micro channel for the last 10 months, there are no signs of exhaustion, allowing traders to continue buying on high-1/high-2 opportunities.
- The increased frequency of bear bars could indicate a potential upcoming trading range.
- Patterns
- The market has successfully executed a bull breakout of the wedge top.
- However, it’s essential to note that the usual odds of a successful bull breakout from a wedge top are 25%.
The Daily Nifty 50 chart

- General Discussion
- Nifty 50 resides within a wedge top and a bull channel, signaling that bears should wait before considering selling until a bear breakout of the wedge top occurs.
- With the market also trading inside a bull channel, bulls are inclined to buy near the bottom of the channel.
- Bulls holding long positions are advised to continue holding until a strong bear breakout of the wedge materializes.
- Deeper into the Price Action
- Notably, in the recent bars, bears have struggled to form strong consecutive bear bars, diminishing the likelihood of a reversal.
- Concurrently, bulls consistently form strong consecutive bull bars with bull gaps.
- Despite a strong reversal attempt by bears in the previous week, the lack of follow-through led to a failed reversal attempt.
- Typically, after a failed bear reversal attempt, the market tends to move two legs up.
- Patterns
- The market is approaching the top of the wedge pattern, signaling a potential breakout in the coming week.
- If bears manage to produce a strong bear bar of the wedge top, the likelihood of a trading range, equivalent to the height of the wedge, is higher than that of a reversal.
Market analysis reports archive
You can access all weekend reports on the Market Analysis page.

