Market Overview: FTSE 100 Futures
FTSE 100 futures went sideways last week with a bear reversal bar. It was a bull doji but with a collapse on Friday evening. We are still in a tight channel but disappointing FT for the bulls, so likely buyers below not above. Nothing to sell for bears yet, but they might start to scale in above, betting more sideways into the Christmas period.
FTSE 100 Futures
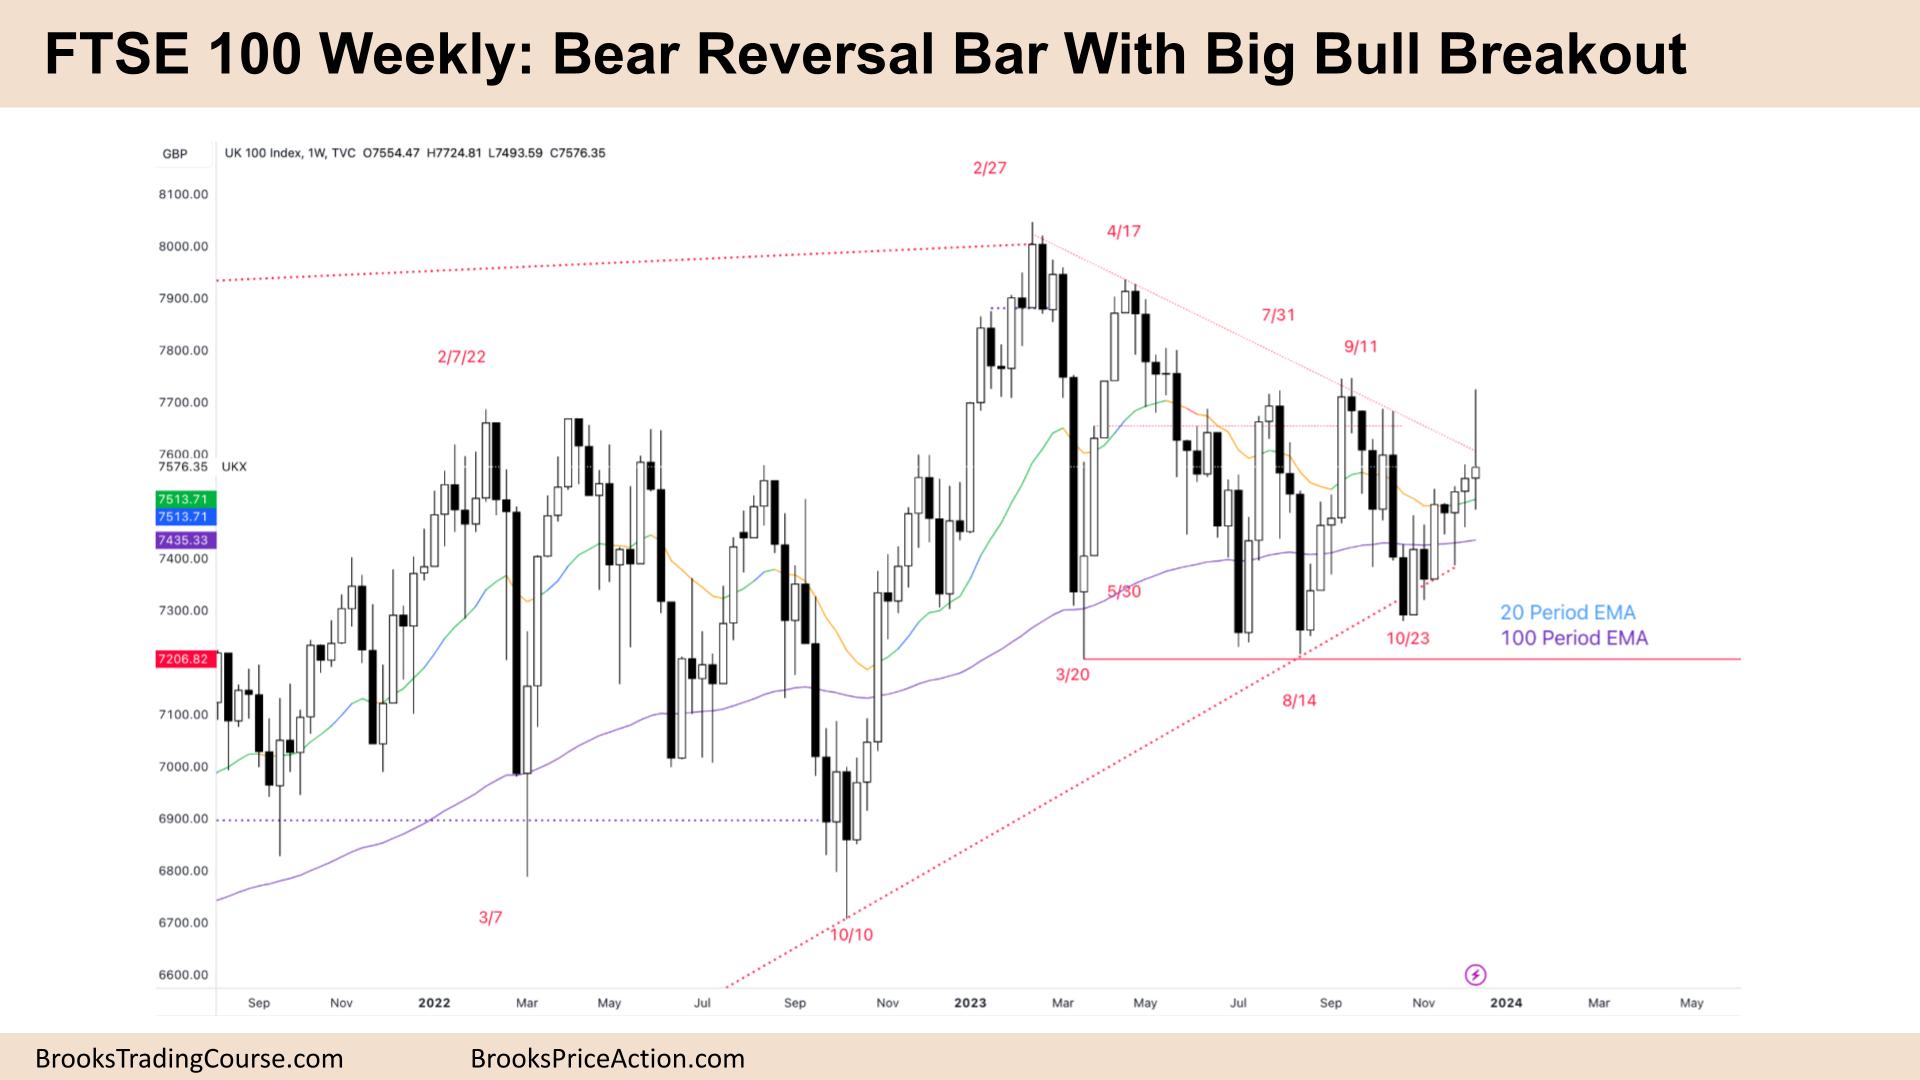
The Weekly FTSE chart

- The FTSE 100 futures last week was a bull doji but a bear reversal bar with a big tail.
- Why a bear reversal bar? Because on a lower timeframe, it reversed strongly. So traders should watch to see if that reversal gets a follow-through – a breakout in the other direction.
- The bar closed near its open. A small body and big tail above is a weak signal to buy above or sell below. Next week, we will likely go sideways.
- The bar closed below its midpoint, so some computers see it as a bear bar. But not a good sell signal.
- It is the third consecutive bull bar closing above the MA – so some bulls will see it as always in long. Probably more buyers below.
- Bulls see a HL, a DB and a test, or a triple bottom. They saw they made a new high and a higher low, so we’re on the buy from October.
- But bears could still be in their sell also. The bears see three pushes up a wedge bear flag a HH DT and strong legs down to the MA.
- Both sides are right because it is BOM and two competing trend lines.
- Most traders should trade a different timeframe – reversals on every bar here, and traders are BLSHS and taking quick profits.
- Bulls want to buy the close or get a buy-above bar, but this went too far. Likely, any scalpers took their 2:1 windfall profit and are on the sidelines waiting for a new setup.
- Expect sideways to up next week.
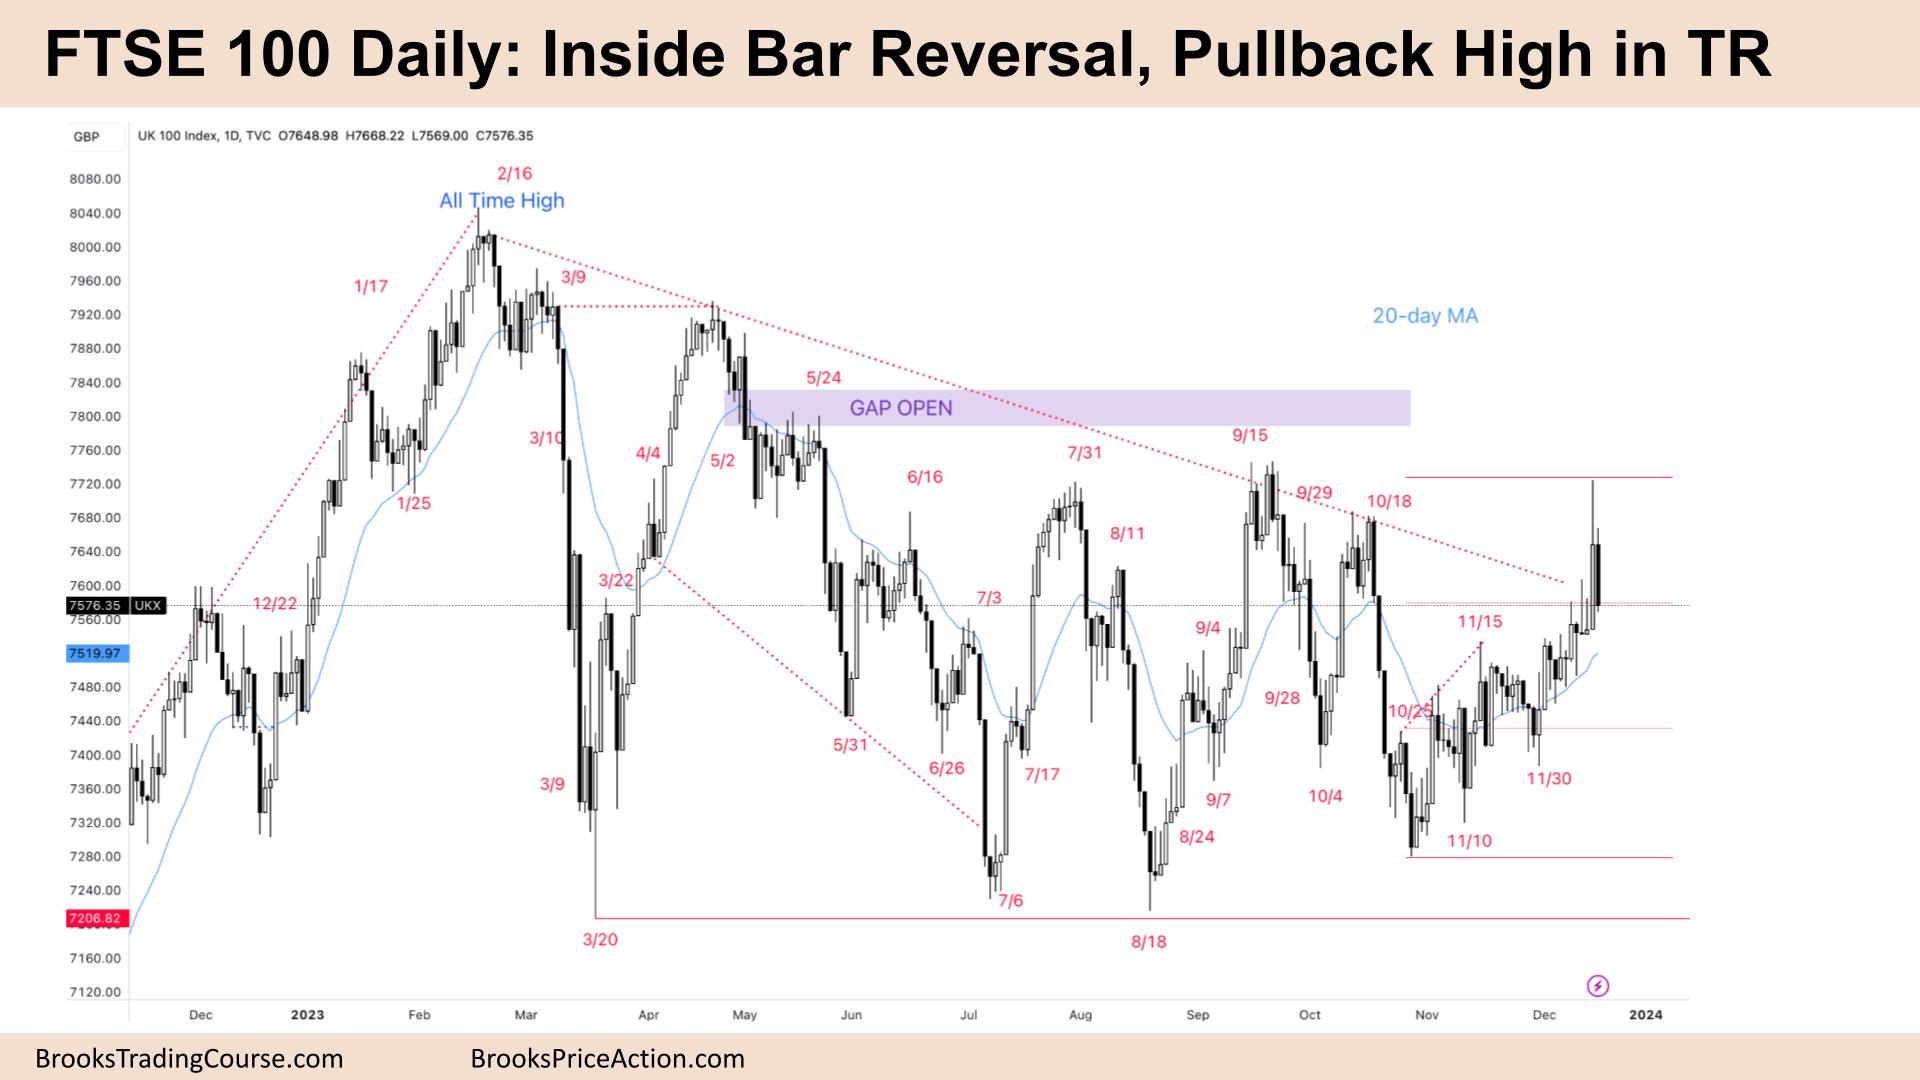
The Daily FTSE chart

- The FTSE 100 futures was a bear inside bar on Friday. It closed on its low, so we might gap down on Monday.
- It follows a big bull breakout from the top of a HTF trendline.
- But it is confusing. Big bull BO but bad close – big tail. Bulls want to buy below.
- But bears sold it immediately. So it makes you wonder if that was a profit-taking bar.
- It was a weak signal on Wednesday, so traders expected to come back and test it, which we did.
- Bulls see a small pullback bull trend. But high above the MA, so it might need a couple of legs sideways to down to find more buyers.
- Bears see the top of a trading range, a wedge bear flag up to test the last sell climax. That close will worry the bulls next week.
- Bulls have a stop far away, which means they still have probability.
- Bears might sell the close, but probably more selling above the high of that inside bar, betting we will go sideways and not straight up.
- The bulls want to close that gap above. But they need a bear BO to fail below this inside bar and find buyers. They want to maintain closes above this range for a big MM above.
- The bears want a repeat of October – 3 big bear bars in a row.
- Expect sideways to up next week still.
- Inside bars are generally weak signals depending on the context. Usually, it would be a better fade (buy) below it, but with such a strong close, some limit order traders will wait or look to buy an MM below that bar.
- The MM is the distance of that inside bar.
Market analysis reports archive
You can access all weekend reports on the Market Analysis page.

