Market Overview: NASDAQ 100 Emini Futures
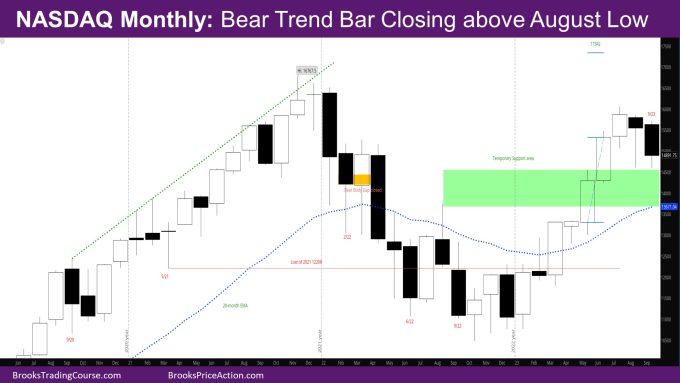
The NASDAQ Emini futures September monthly Nasdaq Emini candlestick is a bear trend bar closing above August low with a small tail below.
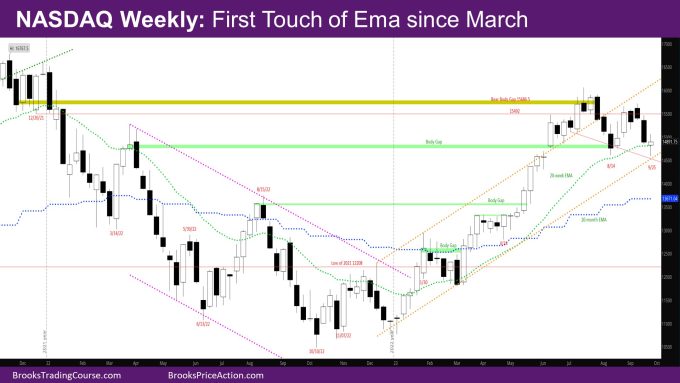
The week closed as bull doji reversal bar at the weekly exponential moving average (EMA), with tails above and below and close above the EMA.
NASDAQ 100 Emini futures
The Monthly NASDAQ chart

- The September month bar is a bear trend bar with a small tail below.
- The month pulled back below the August low and closed above the August low.
- This was expected as August was a bad bear bar – with a long tail below.
- At the same time, the September month did close below July low.
- Bulls want the next month to be a strong bull bar that marks the start of the next leg.
- Bears need a strong follow-through bar with a close below September.
- Likely the month will be something in between – a doji bar with tails and a close above September low.
- The next target for the bulls is a close above the July close.
- Bears would like a close below the prior month. They would also like to reach the May close.
- It is likely there were sellers at the May close betting on a failed breakout.
- If the market does get to the May close, it should find support.
The Weekly NASDAQ chart

- The week is a bull doji reversal bar with tails at the EMA.
- This is the first time the market has touched the EMA since early March.
- As mentioned in last week’s report, bears needed a follow-through bar to last week to convince sellers of more down.
- This was less likely since the weekly EMA should act as temporary support.
- At the same time, bulls failed in creating a strong bull reversal bar.
- This week allowed buyers below the strong bull bar of 8/28 to get out breakeven.
- If buyers bought more this week below the low of the 1st strong leg down , they were able to scalp.
- Given the strong bear bar last week, it is likely there is another leg down, even if for one bear bar.
- As mentioned in prior reports, the pullback from 8/21-9/11 looked like a wedge bear flag, which usually needs two legs of correction.
- There are likely sellers higher – close of the inside bear bar of 9/4, which usually doesn’t breakout.
- There may have been buyers buying that inside bear bar after the strong bull bar of 8/28 expecting another leg up.
Market analysis reports archive
You can access all weekend reports on the Market Analysis page.

