Market Overview: NASDAQ 100 Emini Futures
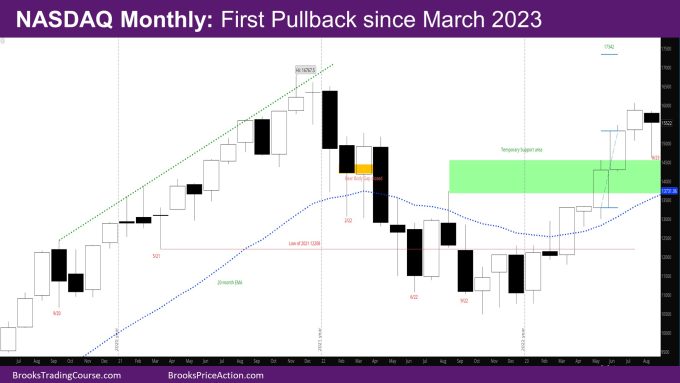
The Nasdaq Emini futures August monthly candlestick is a doji bear bar with a big tail below. This month is the first pullback since March 2023 and the first bear body since February.
The week closed as bull trend bar with small tails, closing above last week’s high.
NASDAQ 100 Emini futures
The Monthly NASDAQ chart

- The August month bar is a doji bear bar with a long tail below.
- This month pulled back below July low and closed above the July low and above the mid-point of the bar.
- Previous reports had mentioned that if the market pulls back, it will likely find support between the May close and August 2022 high.
- The market reversed from slightly above the May high.
- Bears wanted a close below the low of last month. Bulls wanted a close above the low of last month, and a close above the mid-point of the bar.
- Bulls got what they wanted.
- If September sells off again, there will likely be buyers in the lower half of August.
- 2023 so far is an inside bar. The question is – Will there be sellers above the 2022 high?
- The next targets for the bulls are –
- The all-time high close of Dec 2021 – 16338.75
- The all-time high in November 2021 at 16767.5
- The Measured Move (MM) based on high of August 2022 and low of October 2022 – at 16996.75 which would be a new all-time high.
- The MM based on the bodies of May and June 2023 – at 17342
- Bears would like a close below the prior month. That will be the first signal to indicate they can sell higher.
The Weekly NASDAQ chart

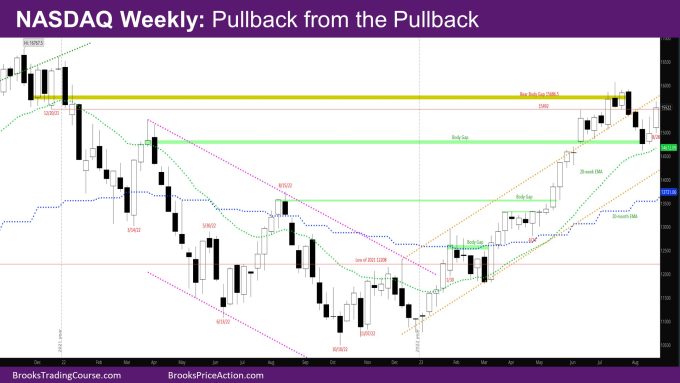
- The week is a surprise bull trend bar with small tails.
- It is a surprise because it follows last week’s doji bar and was likely to be another trading range bar.
- This week is strong also likely because bulls wanted the month to close as strongly as possible, and those bulls might scalp out.
- The market is back in the region around 15492 where limit order bulls may have bought the low of Week of 7/24 during the week of 7/31 expecting more up (shown with a red line on the chart)
- These bulls were trapped by the 2 bear bars following the week of 7/31.
- It is likely that those bulls will sell now, thus making next week or two bear bars or have long tails below them.
- Bulls also want a better buy signal bar closer to the exponential moving average (EMA).
- The signal bar 2 weeks ago was a bear bar. Last week triggered the signal bar but closed below the high of the signal bar. This week is a breakout attempt above last week.
- If next week is a bear bar, it may be the start of the 2nd leg down.
- If next week is another bull bar, it is likely there will be a small second leg up before the 2nd leg down starts.
- The market should also test the exponential moving average (EMA) in the next few weeks.
- If bulls can keep going up from here instead, the body gap close with March 2022 would be a considered a negative gap – a small overlap and trend resumption up.
Market analysis reports archive
You can access all weekend reports on the Market Analysis page.

