Market Overview: FTSE 100 Futures
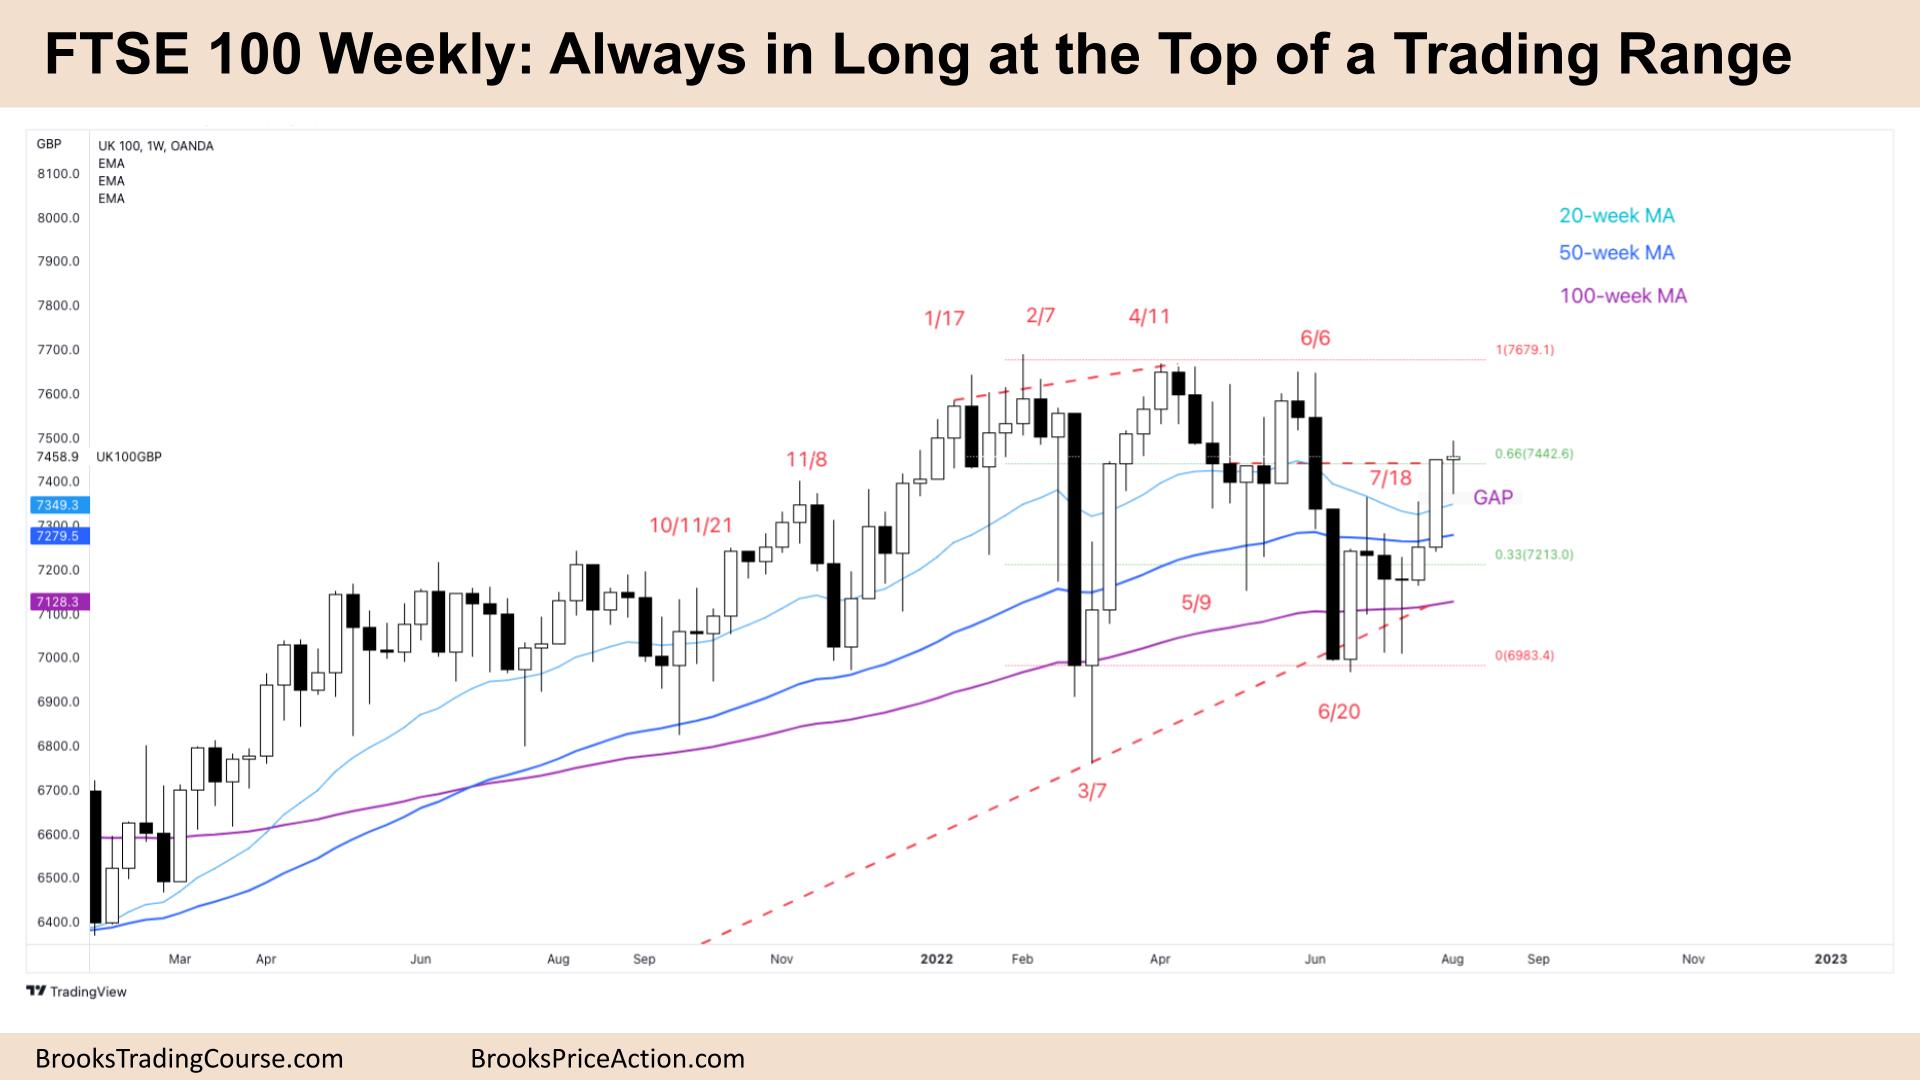
FTSE always in long at the top of a trading range. We are back in the tight trading range from May so we might go sideways here. The bulls want a follow-through bar to break above, back to the highs of the range and bears want a decent sell signal. Both might get disappointed here.
FTSE 100 Futures
The Weekly FTSE chart

- The FTSE 100 futures was a small bull doji with tails above and below.
- We are back in the tight trading range from May which we have been saying was a magnet we would come back to.
- For the bulls, it’s 3 consecutive bull bars, one big and closing on its high so it’s always in long at the top of a trading range. Its either a 7-bar or 3-bar bull channel. But tails are above and below so not a great buy signal. More likely sellers above and buyers below.
- Bulls see we have closed back above the 20-week moving average (MA) and see it as a trend resumption after the June sell climax.
- The bears see we are in the top third of a trading range so the math is better for selling. They have made money selling here for 6 months and will likely continue to scale in short above bars.
- They see a pullback from the June 6th spike and expected two legs sideways to up before resumption down.
- They know only 3 of the past 10 bars have been above the moving average so we might go below it again soon.
- The bulls want a follow-through bar breaking out of the tight trading range to the left. They see a small tail gap between this week and July 18th so they might get it.
- But you can sense the hesitation. Big bull bar, pause, big bull bar and pause again. So although we are on the High 2 buy above July 18th it’s not as bullish as it could be.
- The bears see a possible wedge this week with June 27th and July 18th and might look to sell a wedge reversal or Low 1. But they need a bear bar closing below its midpoint.
- The location is ok for selling in the top third of a trading range but it’s a bad sell signal, 3 consecutive bull bars – so they might scale in higher and look to sell a Low 2 instead.
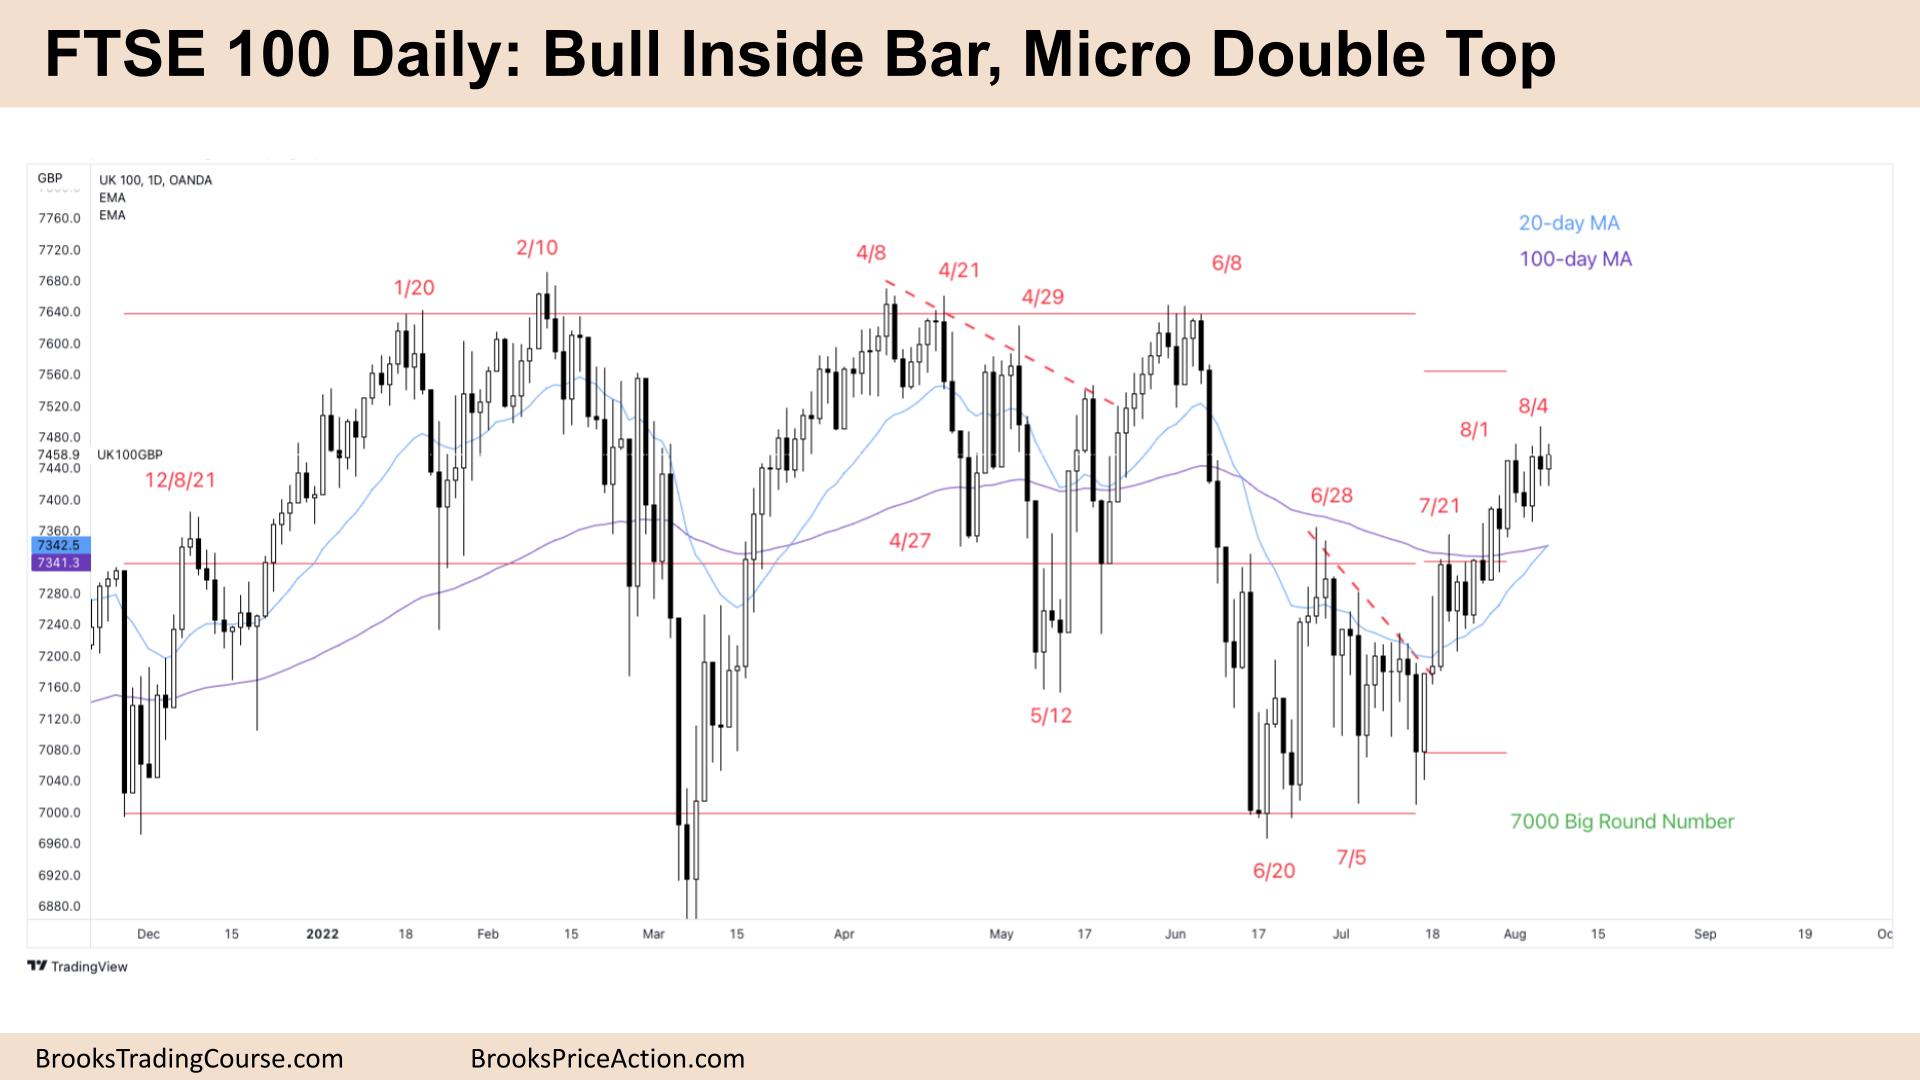
The Daily FTSE chart

- The FTSE 100 futures was a small bull inside bar on Friday. It is the 5th day in 6 days we have struggled to close higher so we might pullback soon.
- The bulls see a tight bull channel, a small pullback bull trend and a breakout from July 21st and are expecting the measured move up. It has been many bars above the moving average and expect to buy any pullback below for another leg up.
- But even though the bull bars are closing on their highs there is bad follow-through so we are more likely entering a trading range here.
- The bears see a deep pullback from the June spike down, a double top or micro double top and will look to scale into sells.
- It’s a Low 2 sell below Friday but consecutive dojis and bull doji is a bad signal.
- Tight channel so likely buyers below and sellers above. Bears want bear bars closing below their lows and consecutive sell signals.
- If you look left, the bear legs all started with good sell signals so until we see that the bulls will probably keep buying. Channels can last much longer than traders expect.
- If we do get a pullback, probably bears will scalp out at the moving average and bull buy a High 1or High 2 back up for the 3rd leg of the wedge.
- Most traders should be long or flat. If you’re selling wait for a decent bear bar closing on its low, better consecutive bear bars before getting ready.
Market analysis reports archive
You can access all weekend reports on the Market Analysis page.

