Trading Update: Friday July 1, 2022
Emini pre-open market analysis
Emini daily chart
- Yesterday was a small doji bar which is disappointing to the bears on the daily chart.
- Emini bulls likely higher low favored with second leg up testing the June 28 high.
- Bulls want a break above the June 28 high and test the 4,000 big round number.
- Next, the bulls want a test of the June high, which is a major lower high. If the bulls can get a decent close above the June high, the daily chart would likely be in a bull trend or a trading range, not a bear trend.
- The bears want the June 28 selloff to lead to a breakout below the June 17 low. They want the market to continue making lower highs and lows.
- While the market is in a bear trend, the bulls are getting a lot of buying pressure which is a sign that the market is forming a trading range.
- Also, the higher time frames, such as the monthly chart, have been in a bull trend for several years, and the 2022 selloff looks more like a pullback than the start of a trading range. In other words, bull trends (monthly chart) do not go immediately into bear trends; they form trading ranges and, even after that, usually go sideways. This means that the odds favor a rally on the monthly chart.
- Overall, today may have a bull close as bears are more disappointed following the June 28 bear trend bar.
- Today is Friday, so the weekly chart is important. This week is a big bear trend bar right now. The bulls want today to rally and create as big of a tail as possible.
- The bulls will try to close above the midpoint of the week, around 3,852. Bears want the opposite and today to close around the week’s low, creating a Low 1 short.
Emini 5-minute chart and what to expect today
- Emini is up 2 points in the overnight Globex session.
- Odds favor a trading range price action open.
- Since a limit order open is most likely, traders should be cautious on the open and consider waiting for 6-12 bars before placing a trade.
- Trader can also wait for a credible stop entry or a strong breakout with follow-through breaking out from the opening range.
- The most important thing to remember is most moves will reverse on the open, so traders need to be cautious. Generally, there is a 50% chance that the initial move will completely reverse.
- Since the odds may slightly favor a dull day, traders will pay attention to buy setups if the market is below the open of the day and the day does not look like a strong bear trend.
- Since today is Friday, traders need to be cautious about a surprise breakout late in the day as traders fight over the appearance of the weekly chart.
Yesterday’s Emini setups


Al created the SP500 Emini charts.
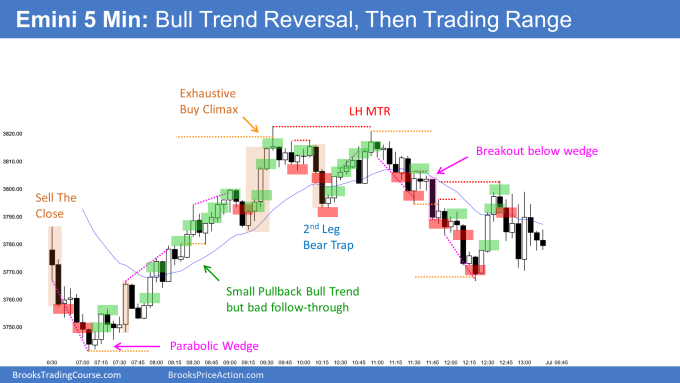
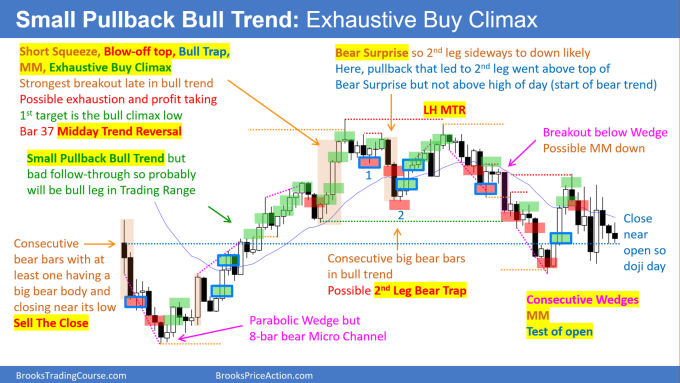
Here are several reasonable stop entry setups from yesterday. I show each buy entry with a green rectangle and each sell entry with a red rectangle. Buyers of both the Brooks Trading Course and Encyclopedia of Chart Patterns have access to a much more detailed explanation of the swing trades for each day (see Online Course/BTC Daily Setups).
My goal with these charts is to present an Always In perspective. If a trader was trying to be Always In or nearly Always In a position all day, and he was not currently in the market, these entries would be logical times for him to enter. These therefore are swing entries.
It is important to understand that most swing setups do not lead to swing trades. As soon as traders are disappointed, many exit. Those who exit prefer to get out with a small profit (scalp), but often have to exit with a small loss.
If the risk is too big for your account, you should wait for trades with less risk or trade an alternative market like the Micro Emini.
EURUSD Forex market trading strategies
EURUSD Forex daily chart

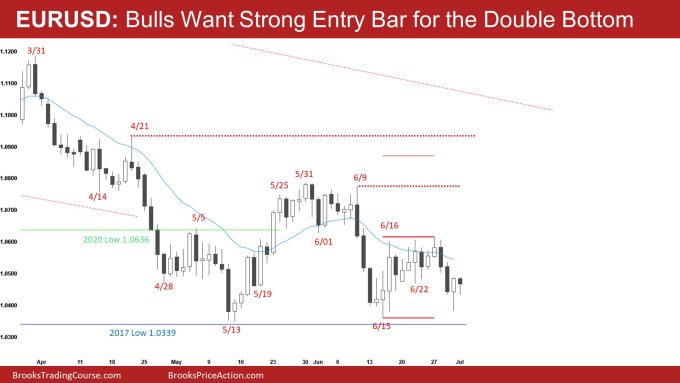
- The bulls got a strong reversal bar following the June 13 bear close test and the June 15 low.
- Yesterday was also the third reversal up from the 2017 low since May, which increases the probability of the market getting a rally here.
- Bulls see yesterday as a signal bar for a higher low double bottom major trend reversal with June 15.
- The bulls hope that the market will break above the neckline (June 27 high) and get a measured move up to 1.0871, which is about the June high.
- Bears want the opposite and a breakout below the 2017 low. While it is possible, even if the market does fall below the 2017 low, there will probably be buyers, and the market will create a failed breakout of a double bottom.
- The bears can still argue the market is in a bear trend. The bulls need to get above the June major lower high, making the market either a trading range or a bull trend.
- Overall, the bulls have an excellent-looking signal bar (June 30). The bulls need to trigger the buy and have a strong close today, creating a solid entry bar for the higher low double bottom. Bulls hope today will look like May 27, a bull trend bar closing on its high.
- Today is Friday, so the weekly chart is important.
- The bulls want the market to close above last week’s low of 1.0469. Next, bulls would wish to close above the midpoint of the current week (1.0502).
- The bears want the opposite of the bulls and for this week to close below last week’s low and create as small a tail below this week’s bar as possible.
Summary of today’s S&P Emini futures price action and what to expect tomorrow

Al created the SP500 Emini charts.
End of day summary
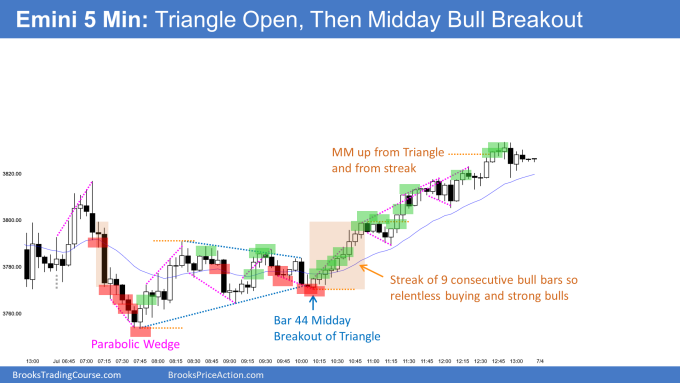
- Today was a triangle open that led to a midday bull breakout.
- The day opened with a parabolic wedge top that led to a selloff in the form of a parabolic wedge bottom.
- The market went sideways in a triangle (blue lines) until around 10:15 when the market had a failed bear breakout of the triangle, which followed a strong buy the close bull micro channel up to 10:45.
- The 10:45 bull breakout was nine consecutive bull bars closing above the triangle’s high. This increased the odds of a channel up and possible measured move up of the 9-bar bull breakout.
See the weekly update for a discussion of the price action on the weekly chart and for what to expect going into next week.
Trading Room
Traders can see the end of the day bar-by-bar price action report by signing up for free at BrooksPriceAction.com. Al talks about the detailed S&P Emini futures price action real-time throughout the day in the BrooksPriceAction.com on trading room days. We offer a 2 day free trial.
Charts use Pacific Time
When times are mentioned, it is USA Pacific Time. The Emini day session charts begin at 6:30 am PT and end at 1:15 pm PT which is 15 minutes after the NYSE closes. You can read background information on the market reports on the Market Update page.

