Market Overview: FTSE 100 Futures
The FTSE futures market was a bull doji high in a trading range. Limit order traders have been making money on the higher timeframes and until they stop doing so we will go sideways. On the weekly timeframe stop entry traders can make money if they buy low sell high and scalp. The math is slightly better for the bears but a follow-through bull bar might convince us we can breakout to the range above.
FTSE 100 Futures
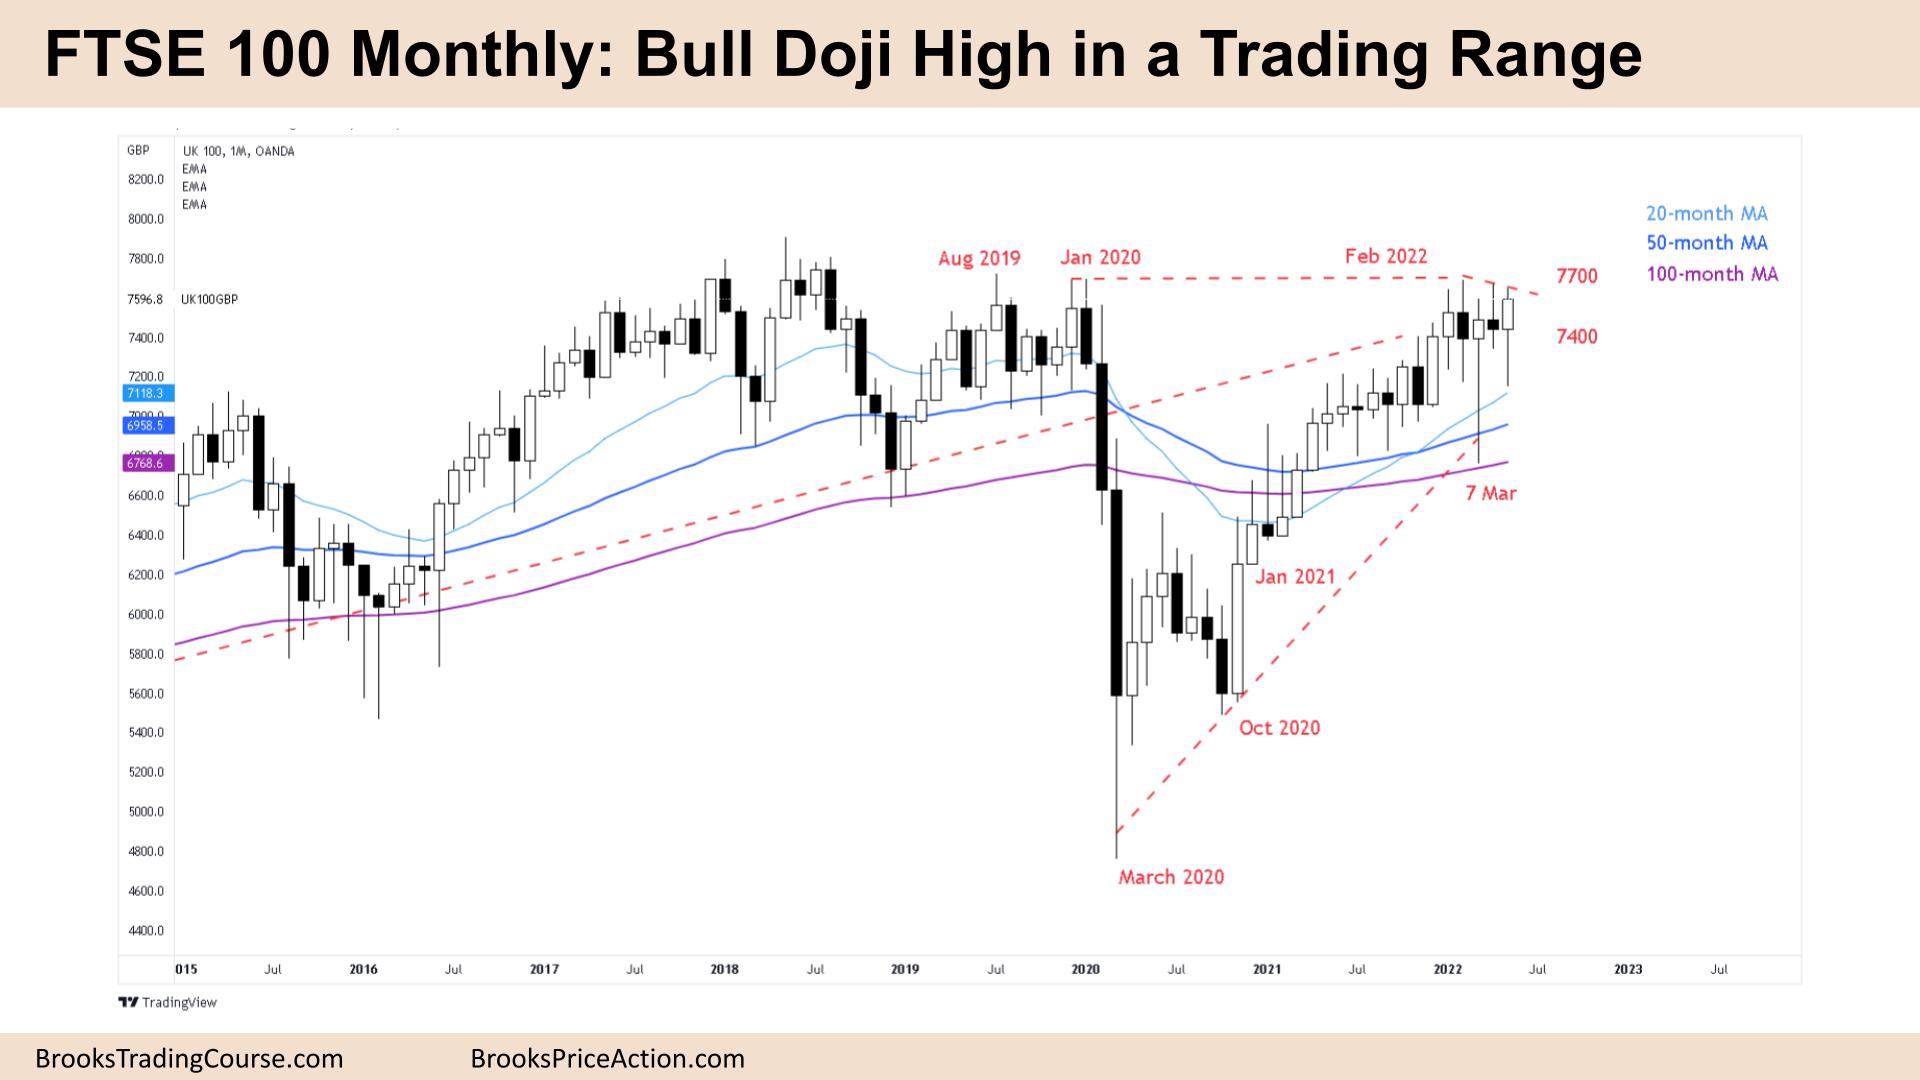
The Monthly FTSE chart

- The FTSE 100 futures was a bull bar closing above its midpoint with a long tail below.
- It is a bull doji high in a trading range with limit order traders selling above bars and buying below bars. Likely we will go sideways again next month.
- For the bulls, they are looking for a High 3, wedge buy, to break above the wedge to continue the bull trend. They want a measured move based upon the height of the wedge.
- For the bears, it’s a final flag and they are looking to fade a breakout.
- When there is something wrong with the bars, it is usually a sign of a trading range. The big bear bar got bought back up. Big bull bar, tail on top.
- We said last month, that it’s breakout mode so the odds are 50% either way and traders should expect failed breakouts. This has remained true. As long as traders are scalping the trend won’t shift.
- The bulls want a strong bull bar or consecutive bars for the measured move. Even a small bull bar with a follow-through High 1 might do it.
- Bears want an inside bar and a Low 1. Currently, the May bar is so large that the risk might prevent traders from entering so low. Traders want to buy low and sell high in a trading range.
- Currently, the math is better for the bears. And as we have been alternating bars each month, it is reasonable to expect bears to sell above the highs and trade a little bit lower next month.
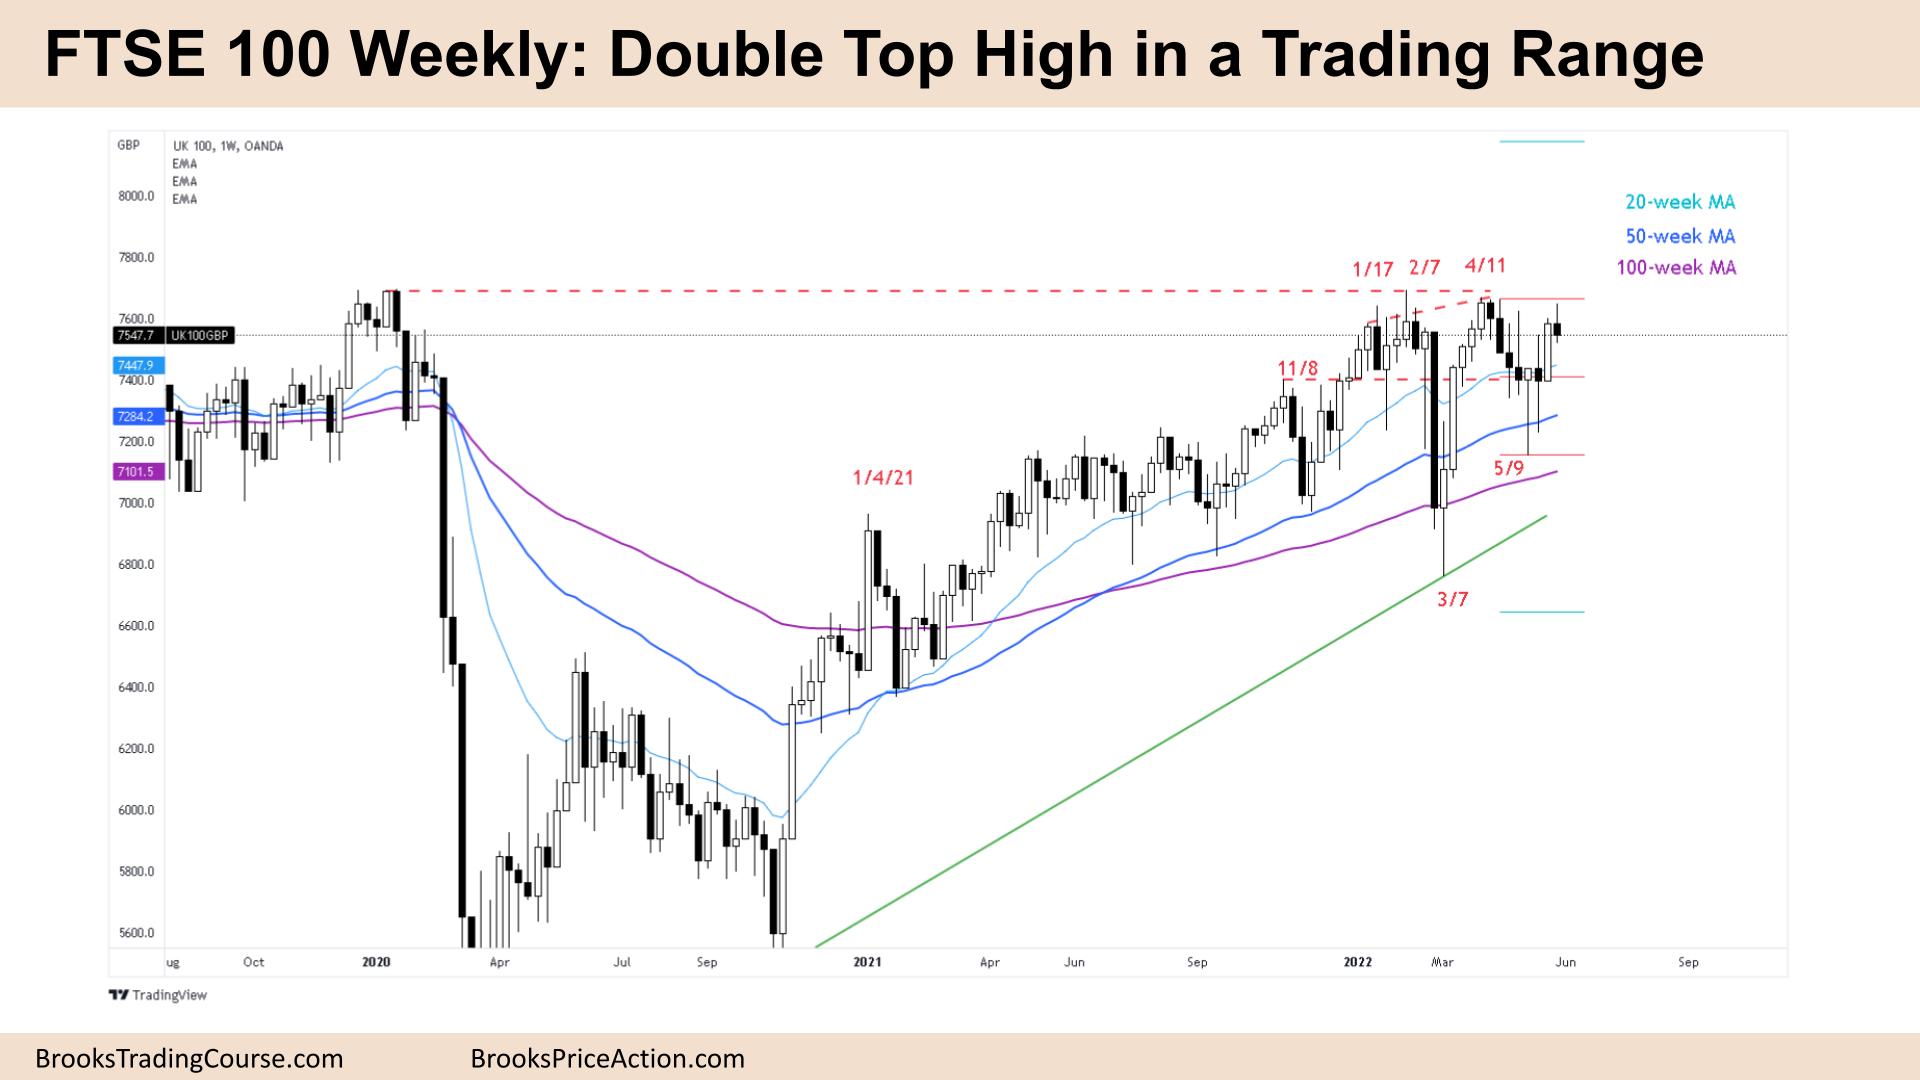
The Weekly FTSE chart

- The FTSE 100 Weekly was a small bear bar with tails above and below. It is a possible double top high in a trading range.
- It was a short week with 2 holidays in the UK last week.
- This sets up a reasonable Low 1 buy or Low 1 sell signal. How can it be both? It’s in a trading range.
- For the bulls, we are still on the High 2 buy above 2 weeks ago. They see a successful breakout pullback from a tight trading range. They expect a measured move up past the highs of the prior trading range top.
- The bears see the bull trend, trendline break and retest for a lower high major trend reversal. They see the bull bar as a bull trap and confirmed by the lack of follow through. They are willing to scale in above and below.
- The bears also see a second entry short at the top of a trading range with April 11th.
- The bulls have been willing to buy below bars for over a year so no matter the pullback, we can expect bulls to keep scaling in. That is why we are going sideways.
- No matter how bullish it looks, trading ranges trick traders into buying too high and selling too low.
- On the daily chart, there are a pair of bear bars but with tails. We can expect bulls to buy below to retest the high of the past 2 weeks before we can see whether there are buyers up there.
- If the bears can sell above these bars again, we might move at least back down to the middle of the range and possibly the extreme.
Market analysis reports archive
You can access all weekend reports on the Market Analysis page.

