ioi breakout mode candlestick pattern: I will update around 6:58 a.m.
The Emini opened with 4 bars with prominent tails within yesterday’s range. This increases the chances that the 3 day tight trading range will grow. While the odds favor today trading either below yesterday’s low, above its high, or both, the probability is that today will not be a strong trend day up or down.
The past 6 days all sold off early selloffs, but reversed up at least briefly. Today is following that pattern, trying to reverse up from just above yesterday’s low. The bulls then want a breakout above yesterday’s high, which would probably be limited.
The bears want this reversal to be weak. They want the bear channel down from yesterday’s high to continue and break below yesterday’s low. Whether or not it does, as I said earlier, the odds still favor a trading range day. This means that there will probably be at least one swing in each direction.
If there is a strong series of trend bars up or down, today could become a strong trend day. This early price action makes a lot of trading range price action more likely. This is especially true because of the context on the daily chart, which I discussed below.
ioi bull flag candlestick pattern: Pre-Open Market Analysis
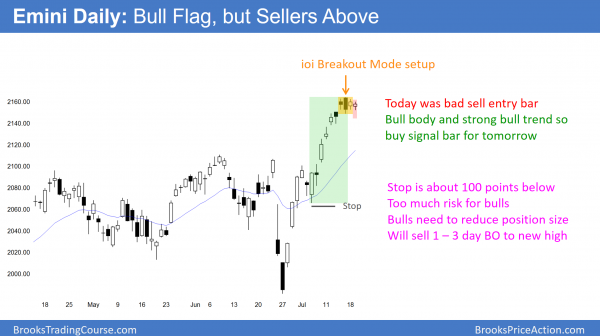
As a result of yesterday being an inside day and Friday being an outside day, the Emini formed an ioi Breakout Mode candlestick pattern. Normally, bulls would buy above yesterday’s high on a stop and bears would sell below its low.
Breakout Mode after a buy climax
Because of the climactic buying over the past 2 weeks, many traders will do the opposite. The Emini rallied strongly and it is in a tight bull channel. This lowers the probability for the bears. When the probability of a reversal down is low, bears prefer limit order entries over stop order entries. Therefore, bears will prefer to sell above yesterday’s high rather than below its low.
Furthermore, bulls do not want to buy too high after a buy climax. They will be less interested in buying above yesterday’s high and more interested in buying below its low. Bulls looking to buy low and bears looking to sell high create a trading range. Consequently, the Emini will probably be sideways for another couple of days. Even if there is a trend day up or down, the odds are that it will reverse on the next day. The bull flag on the daily chart will probably grow at least a couple more days.
Globex Emini
The Emini is down 5 points in the Globex session, just above yesterday’s low. Whether or not the bears break below yesterday’s low and trigger the sell signal, the odds favor at least 2 more days in the bull flag.
Forex: Best trading strategies
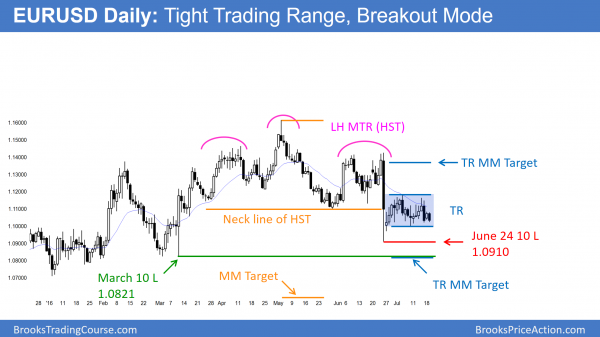
The EURUSD daily Forex chart is in a tight trading range and therefore in breakout mode. The measured move targets are about 180 pips up and down. The measured move target for the Head and Shoulders top (always a trading range) is about 250 pips below the March 10 strong bull reversal day.
The daily EURUSD Forex chart formed an inside day yesterday after Friday’s big bear trend day. That is a signal bar for the bulls and bears. The EURUSD broke below last night, triggering the sell signal. However, it is still within the month-long trading range. The month-long trading range has a double bottom and double top. It is also a triangle, where the 1st push down is the June 24 sell climax.
While the candlestick pattern has several names, everyone agrees on one thing. As a result of a month within a tight trading range, the EURUSD is in Breakout Mode. This means that there is about a 50% chance of either a bull or bear breakout. Furthermore, there is a 50% chance that the first breakout will fail and reverse.
The target for breakout traders is about a 180 pip measured move, which is the approximate height of the trading range. Until there is a breakout, there is no breakout. Most days will have mostly trading range price action, and most day traders will mostly scalp.
European Session
The EURUSD Forex market has dropped about 60 pips in the past 2 hours. It is just above the neck line of the double top of the month-long bear flag. The bears want the bear breakout and a measured move down. The target is just below the March 10 bottom of the big bull trend reversal.
When a market breaks below an important bar like that, there is a 50% chance of a strong breakout. Yet, there is also a 50% chance of a failed breakout and a reversal up. If the bears get their strong breakout, they would then look for a measured move down based on the 400 pip height of the bar.
The bulls are hoping that the overnight selloff is just a sell vacuum test of the bottom of the month-long range. They want a reversal up, which would create a double bottom higher low major trend reversal setup.
5 minute chart
The selloff on the 5 minute chart is in a wedge bear channel. This is a reversal pattern, and good for the bulls. Because the channel is so tight, the 1st reversal up would probably be minor. This means that it will probably fail after 5 – 20 bars and reverse back down. The bulls then might be able to create a major trend reversal. The momentum down has been strong enough so that the best the bulls can reasonably hope to get over the next 2 hours is a bounce in a trading range.
As a result of the wedge bear channel being at support, the bears will probably take profits and look to sell a 20 – 30 pip bounce. While the bears might swing part, they see that the EURUSD is at the bottom of a trading range. Most bears will scalp at least half of their position.
In conclusion, the 5 minute chart will probably enter a trading range for at least 2 hours. Most trading range breakouts fail. As a result, the odds are that this attempt will fail as well and reverse back up. All trading ranges eventually break out. Until there is a strong breakout with follow-through, Forex day traders will bet on reversals.
Summary of today’s S&P Emini futures price action and what to expect tomorrow
This is the daily chart of the Emini. The Emini traded below yesterday’s low and triggered a sell sign. Yet, as I wrote this morning, the bulls bought yesterday’s low. Today is a buy signal for tomorrow, but any rally will probably last only 1 – 3 days before institutions take partial profits.
As expected, yesterday’s sell signal was meaningless. Bulls bought the low, but without enthusiasm. The Emini has been in a tight trading range for 4 days. Even if tomorrow breaks above today’s high, the odds are that the trading range will last at least a couple more day. The 2 week rally was so strong that most institutions will not raise their stops until there are more bars in the bull flag.
Institutions will probably take profits on a rally
As a result of their interest in reducing their position sizes, they will probably sell above today’s high and above the all time high to take partial profits. Consequently, a rally will probably only last 1 – 3 days. They will wait to raise their stops until after a bigger pullback and then a strong breakout to a new high. This means that the bull trend will probably not resume for at least another day or two.
See the weekly update for a discussion of the price action on the weekly candlestick chart and for what to expect going into next week.
Traders can see the end of the day bar-by-bar price action report by signing up for free at BrooksPriceAction.com. I talk about the detailed S&P Emini futures price action real-time throughout the day in the BrooksPriceAction.com trading room. We offer a 2 day free trial.
When I mention time, it is USA Pacific Standard Time (the Emini day session opens at 6:30 am PST, and closes at 1:15 pm PST). You can read background information on the intraday market reports on the Intraday Market Update page.


As a result of yesterday being an inside day and Friday being an outside day, the Emini formed an ioi Breakout Mode candlestick pattern.
How was Friday an outside day? Only the low was outside the prior day’s low. Please clarify. Tks.
Please look at the day session chart or the cash index.
Got it. Now I see it. Tks.
Al – Bought your course and I’ve learned much from it much like physics where if you have the knowledge you see around you what others don’t. A generic question: when trading the SPY (or any other index ETF) should I be watching the SPX or the SPY chart. I noticed that the 5 min charts differ a bit due to the quicker price action on the SPY vs. the SPX.
Thanks
15 years ago, the SPY was a more accurate chart. Computers are so dominant now that the charts are almost identical so it does not matter which a trader trades. I always watch the chart that I am trading.