Emini and Forex Trading Update:
Friday October 18, 2019
I will update again at the end of the day.
Pre-Open market analysis
The Emini reversed down from above Tuesday’s high yesterday and formed a bear doji bar on the daily chart. It is now a weak sell signal bar for a 5 day wedge top. It is nested within a 2 week wedge top. However, the Emini is back in the July and September trading ranges around 3,000. That reduces the chance of a strong move up or down.
Today is Friday so weekly support and resistance can be important. This is especially true in the final hour. The most important prices are the all-time high, last week’s high, and the 3,000 Big Round Number.
Last week was a buy signal bar on the weekly chart. The bulls want this week to close far above last week’s high. That would increase the chance of higher prices next week.
The bears always want the opposite. They want a close below last week’s high. There are now 2 big bull bars on the weekly chart. The bears do not expect a selloff next week. However, if they can stop the rally for a week or two, they would then have a better chance of lower prices in November.
Overnight Emini Globex trading
The Emini is up 2 points in the Globex session. It will therefore probably open within yesterday’s trading range. The minimum goals for the bulls are to have today’s weekly close be above last week’s high and above 3,000.
Even though there is a wedge top on the 60 minute chart, there has been very little energy for 3 days. That reduces the chance of a big bear day today.
I mentioned yesterday that the 60 minute chart has been above its EMA for a lot of bars. That makes it unusual, climactic, and unsustainable. Yet, the price action is not particularly strong. Either the price action has to get stronger or the price has to get weaker. More likely, the price will go sideways to down to the 60 minute EMA today or Monday. That limits the upside today.
Yesterday’s setups

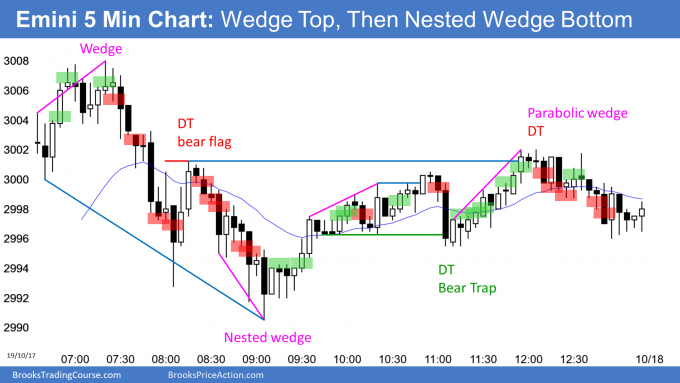
Here are several reasonable stop entry setups from yesterday. I show each buy entry with a green rectangle and each sell entry with a red rectangle. I rarely also show limit order entries and entries on the close of bars. Buyers of the Brooks Trading Course and Encyclopedia of Chart Patterns have access to a much more detailed explanation of the swing trades for each day.
My goal with these charts is to present an Always In perspective. If a trader was trying to be Always In or nearly Always In a position all day, and he was not currently in the market, these entries would be logical times for him to enter.
EURUSD Forex market trading strategies

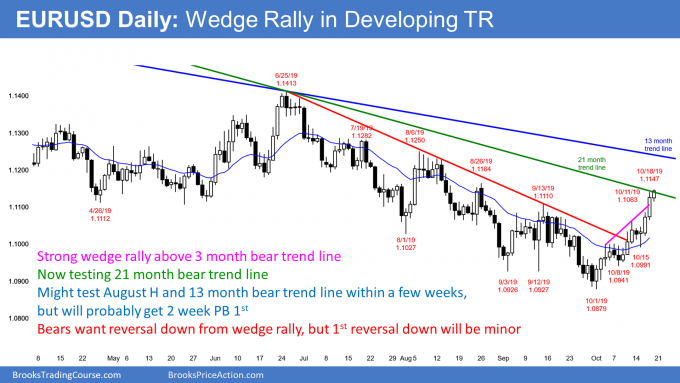
The EURUSD daily Forex chart rallied strongly this week to above the June bear trend line. It is now testing the bear trend line that began with the March 2018 high at the top of the bear trend. The rally is strong enough to continue up to the final bear trend line, which began a year ago. However, there might be a 2 week pullback first.
In addition to the bear trend lines, each of the lower highs in the 21 month bear trend are resistance. That makes them magnets. The June 25 1.1413 high is a major high and this trend reversal might get there in a few months.
However, the 1st reversal up from a tight bear channel typically is minor. The bulls need a test down and then a 2nd reversal up to make traders believe that the bear trend has ended.
The rally has had 3 pushes up and is therefore a wedge. That usually will attract profit takers. But there is no top yet. The bears will probably need at least a micro double top before there is a 2 week pullback.
Even though this rally might fail and the bear trend could continue down, it probably will not fall much below the April 2017 gap at around 1.08
Overnight EURUSD Forex trading
The 2 day rally continued overnight, but so far it has been weaker than it was over the past 2 days. The bulls would like the week to close in its high. That would increase the chance of higher prices next week.
They would also like the week to close above the 21 month bear trend line and above the August 26 high of 1.1164. However, just reaching the bear trend line is a major accomplishment. The bulls might be exhausted and wait for a pullback before buying aggressively again. A climactic rally usually attracts profit taking. That will probably limit today’s upside.
The overnight rally has been in s Small Pullback Bull trend. That reduces the chance of a strong selloff today. The best the bears will probably get is a transition into a trading range and then a few 10 pip scalps.
But since the overnight rally has had many small bars and it is at the bear trend line and just below the August 26 high, there might not be much more buying today. The bull trend will probably transition into a quiet trading range today. The bulls will probably begin to look to buy pullbacks instead of continuing to buy at the market.
Summary of today’s S&P Emini futures price action and what to expect tomorrow

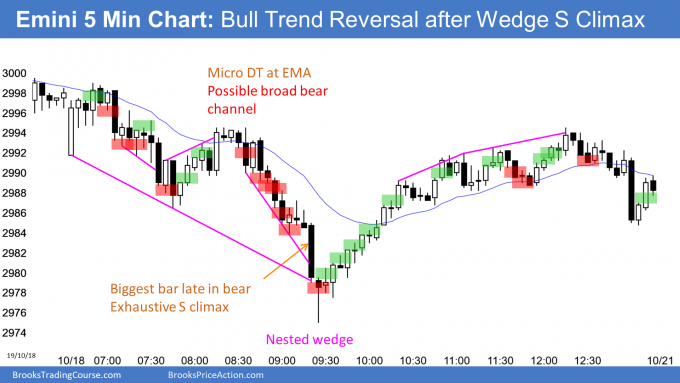
Here are several reasonable stop entry setups for today. I show each buy entry with a green rectangle and each sell entry with a red rectangle. I rarely also show limit order entries and entries on the close of bars. Buyers of the Brooks Trading Course and Encyclopedia of Chart Patterns have access to a much more detailed explanation of the swing trades for each day.
My goal with these charts is to present an Always In perspective. If a trader was trying to be Always In or nearly Always In a position all day, and he was not currently in the market, these entries would be logical times for him to enter.
End of day summary
The Emini triggered a sell signal on the daily chart by trading below yesterday’s low. But like 8 of the past 9 days, it revered. It closed near the open. Today is now a buy signal bar for Monday.
However, it is the 3rd consecutive doji bar and therefore not a strong buy signal bar. Furthermore, 9 of the past 10 days have had at least one reversal. Consequently, traders will expect at least one reversal on Monday.
See the weekly update for a discussion of the price action on the weekly chart and for what to expect going into next week.
Trading Room
Traders can see the end of the day bar-by-bar price action report by signing up for free at BrooksPriceAction.com. I talk about the detailed S&P Emini futures price action real-time throughout the day in the BrooksPriceAction.com trading room. We offer a 2 day free trial.
Charts use Pacific Standard Time
When I mention time, it is USA Pacific Standard Time (the Emini day session opens at 6:30 am PST, and closes at 1:15 pm PST). You can read background information on the intraday market reports on the Market Update page.

