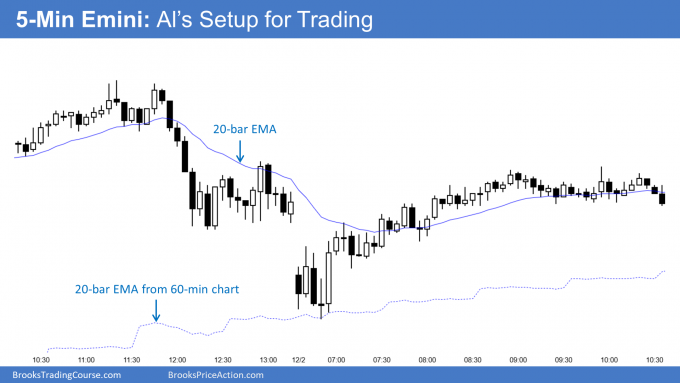
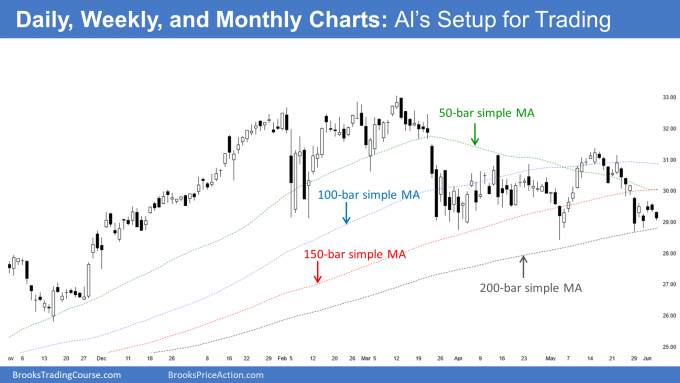
Although it might be hard to believe, my day trading setup uses only a single 13″ laptop for my trading. It has my charts and a trading platform from one or two brokers. A trader does not need any more than this to make money. Just print out a 5-minute chart of any market at the end of the day and you will see many trades. With experience, you might see potential trades on almost every bar on the chart!

Only need one chart
During 99% of the day, I am looking at a single 5-minute chart, which is usually the Emini, but I also sometimes trade Forex markets, bond futures, crude oil, natural gas, stocks, and options. I sometimes look at 60-minute, daily, weekly, and monthly charts.
I have a second laptop that I use for my BrooksPriceAction.com Trading Room, and it additionally has thumbnail windows of the 15- and 60-minute Emini charts, which I use for teaching purposes in the trading room.
It does not matter what type of chart a trader uses. Some prefer charts based on time, and others prefer charts based on ticks, volume, or other factors.
The reason it does not matter is that they all show the same thing. They are simply a record of the trades that have taken place. Technical traders look for repeating patterns that help them anticipate what the market might do next.
Time can be as important as price
What type of chart is a 5-minute chart? It is usually incorrectly called a price chart. All 2-dimensional charts have at least two dimensions. The dimensions are variables and both contribute to a trend. Although a trend cannot be present without price moving up or down, in some trends, time can be more important than price, especially early on.
For example, if there is a bear trend and the market drifts up for a few bars, traders expect the bear trend to resume soon. They refer to the bounce as a bear flag or a pullback, which means they believe it is temporary and that the bear trend is still intact.
However, that is not guaranteed. It is common to see a bear flag continue to pull back higher and higher, and then suddenly the market breaks out to the upside, and converts the bear flag into a bull trend (a bull breakout above a bear flag).
The bull trend began at the bear low, but the first 5 to 10 bars of the bull were weak and were more likely part of a bear flag. When the bull trend was beginning, the chart was still in a bear flag. That meant that a resumption of the bear trend was more likely than a reversal into a bull trend.
But all of those bars that worked slowly higher in the bear flag indicated that the bulls were relentless. Even though the pattern was still a pullback in a bear trend, the bulls were owning a lot of bars. They were in control for a long time. It was only after the market broke strongly to the upside, that traders concluded that the price was trending up (instead of temporarily bouncing in a bear trend).
20-bar exponential moving average (EMA)
I use a 20-bar EMA on my intraday charts. On my 5-minute charts, I also plot the 20-bar EMA from the 60-minute chart as well, because the market often treats both as support and resistance. A trader can additionally add the 20-bar EMA from the 15-minute chart, but it does not add much and it makes the chart cluttered. Too many things on a chart distracts traders from the bars on the chart, and they need to be able to see the patterns that the bars are creating to find trades.
With High Frequency Trading firms getting so much press because some are incredibly profitable, there is a tendency among traders to move toward smaller and smaller time frame charts. I have noticed that there are several people promoting these charts as a way for traders to make money. I strongly believe that most traders will only lose and never win long-term if they use very small time frames.
I address the reasons in the Brooks Trading Course, but the most fundamental one is that these charts do not give traders enough time to think clearly. This results in them making too many mistakes. A 5-minute chart is a good place to start, and I recommend avoiding any chart where there are more than 20 bars per hour.
Day session or 24-hour charts?
It is simply a personal preference. I have traded online years ago with many successful traders who used 24-hour charts. They liked to take some trades before the day session opened, and they liked the feeling of being a part of the world’s 24-hour market. Many institutions use 24-hour charts, but many also use line charts instead of candlestick charts, because they are trading based on factors other than simple chart patterns.
I enjoy imagining myself as somehow tied to the stock market, which is the world’s financial epicenter, and the day session obviously mirrors it exactly. Also, I rely heavily on trend lines, and I believe that trend lines in the day session are more accurate because there is so much dead time overnight.
I do not want to weigh those hours equally with the day session hours because there is far less movement for extended periods of time (tight trading ranges). I think such periods are less important. If I were trading a tick chart, it would not matter because those protracted tight trading ranges would be compressed into a few bars. However, on a 5-minute chart, 1 hour at 2 am occupies as much of the screen as an hour during the day, yet it is far less significant.
Finally, I am a minimalist and do not want to watch more than one chart. I already see about 50 trades a day on the day session 5-minute chart, and I do not need to see any more.
Continuous charts or just the current contract?
This is an issue for futures traders because there are many expiration dates for futures contracts. You should only be trading the “front month.” That is the contract that is going to expire next. It is the one that has most of the volume.
For example, if you are trading the Emini, the front month will expire every 3 months. If today is January 12, the next contract that will expire is the March contract. That is the one that you should trade.
A week before it expires is “rollover day.” That is when the exchange will make the June contract the front month, and it is the day when they adjust the “continuous charts” (see below). Even though there is a week remaining in the March contract, most day traders will switch to trading June on the day after rollover day when June picks up most of the volume.
But if you look at the monthly chart of the June contract, it will only have about 15 bars. That is because the Chicago Mercantile Exchange, which owns the Emini, creates a new contract about 15 months before it expires.
With only 15 bars on June’s monthly chart, traders do not have much information. Yet, the Emini has a history that goes back to 1997. That is useful data if you are looking at monthly charts. The exchange and brokers therefore create continuous charts.
The most recent bars on the daily, weekly, and monthly charts are from the front month, which became the front month on rollover day. Before that, the bars are from the expired contracts. Your broker adjusts the price of all of the earlier bars on every rollover day by adding or subtracting a constant from all prior data. There is an industry standard about how to to calculate the constant.
As I said, I trade the front month. But for charting, I use continuous charts, even for the 5-minute chart. This is because I can quickly toggle the chart into a daily, weekly, or monthly chart. When I do, I want to see more bars than are present on the chart of the front month. Today’s 5-minute chart is exactly the same for the front month and the continuous chart, because the continuous chart has been using the front month since rollover.
EasyLanguage for indicators
I wrote indicators in TradeStation’s EasyLanguage that very accurately plot the 15- and 60-minute EMAs on the 5-minute chart.
15-minute EMA plotted on a 5-minute chart
Inputs: length(20);
If CurrentBar = 60 then Value1 = xaverage(C, 60);
If CurrentBar > 60 then begin
If Fracportion(time/15) = 0 then begin
value1 = value1[1] + (2 / ( Length + 1 )) * ( C – value1[1] );
Value2 = value1;
Plot1(value1, "15 min 20EMA");
end
else begin
Value2 = value1 + (2 / ( Length + 1 )) * ( C – value1[1] );
Plot1(value2, "15 min 20EMA");
end;end;
60-minute EMA plotted on a 5-minute chart
Inputs: length(20);
If CurrentBar = 240 then Value1 = xaverage(C, 240);
If CurrentBar > 240 then begin
If Fracportion((time – 30)/100) = 0 or time =1315 then begin
value1 = value1[1] + (2 / ( Length + 1 )) * ( C – value1[1] );
Value2 = value1;
Plot1(value1, "60 min 20EMA");
end
else begin
Value2 = value1 + (2 / ( Length + 1 )) * ( C – value1[1] );
Plot1(value2, "60 min 20EMA");
end;end;
Bar count number indicator for 5-minute chart
You can download an indicator for TradeStation to add bar numbers for the 5-minute chart.
My Setup for Day Trading: Daily, Weekly, and Monthly charts

Trade all markets and time frames the same

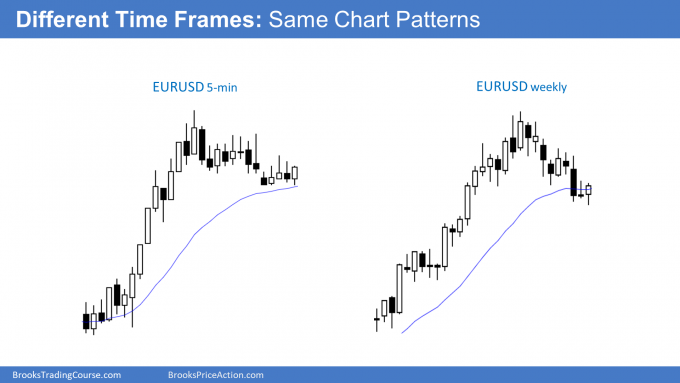
One of the basic tenets of price action is that markets are fractal. This means that if you remove the axes, you cannot tell if the chart is a 5-minute, 60-minute, daily, weekly, or any other type of chart.
The charts simply represent human behavior, which is genetically based and reflected on every chart, regardless of time frame. Price action traders see all charts as the same, and use the same techniques on all of them, and you will, too, after you learn how to trade.
Are there just a couple of entries a day?
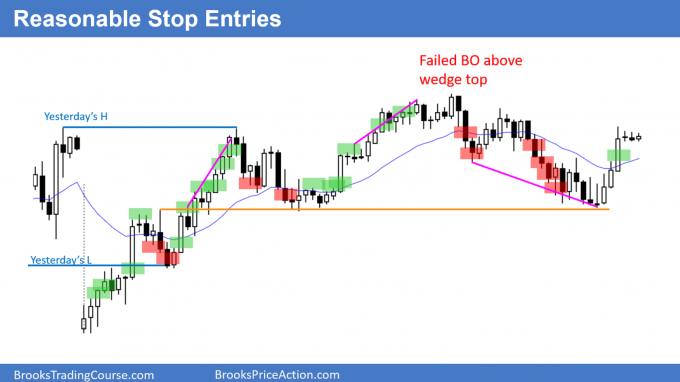
I often read posts about how to trade where the authors make it sound like you can only take trades on a small percentage of the bars. Well, the institutions are trading heavily on every bar, and if you want to make money, you have to copy what they are doing.
You will soon learn that there is usually a way to make a profitable long trade, and a profitable short trade at every moment, and that is why there are institutions buying while others are selling all day long. Many are trading for tiny profits and others are hedging and scaling in and out.
All of this is beyond what most individual traders should be doing, but there are far more logical entries every day that what candle pattern sites would have you believe.

Should you enter or exit on every bar as you day trade futures, foreign exchange, or the stock market online? Obviously not, but be aware that there are trading opportunities at every second of the day, not just when a certain major pattern is present.
If you understand the market cycle, what the market is doing at the moment, and how to structure and manage trades, you are in a position to make a profitable trade at any time of the day.
I discuss techniques for entering at all phases of the market cycle. Most traders feel comfortable with a particular approach and will not take trades during most market conditions. We all have our own personality traits and each is better suited for different environments. Part of our journey is to learn our comfort zone and try to stay there when trading.
The Brooks Trading Course discusses entry and exit techniques, as well as money management, for all parts of the market cycle, and I designed it to help you learn how to trade.
Thank you for reading my How To Trade Price Action manual.
The next article is What trading account size do I need to trade?
Complete list of links for all How to Trade Price Action Manual chapters.

