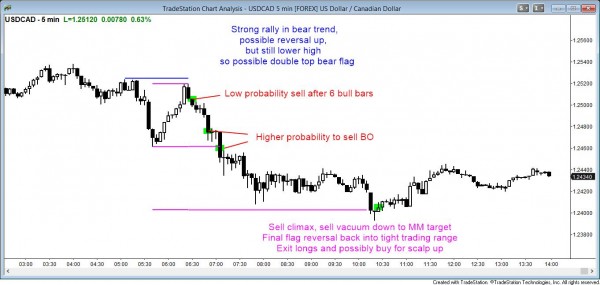
Example of foreign currency exchange trade of the week: Forex double top bear flag in USDCAD 5 minute chart
The 5 minute Forex USDCAD candle chart had a strong rally, but failed to get above the prior lower high. This trapped bulls into buying high and bears into waiting to short.
The 5 minute Forex USDCAD candle chart on Thursday had a strong, 7 bar rally that started at 5:50 a.m. PST, and it contained 6 bull trend bars with closes above their midpoints. However, it formed a double top with the prior lower high and the market fell for a measured move down. This is an example of a Forex double top bear flag.
It is natural to look at a strong rally and assume that the odds favor a 2nd leg up after any pullback. However, until there is a breakout above the prior lower high, the market is still in a bear trend. Because of that, it is dangerous to buy a pullback with limit orders. Instead, traders looking for the pullback to form a higher low and then a second leg up should wait to see a credible buy signal bar and then buy on a stop place 1 pip above that signal bar. The bulls never got their buy signal. Instead, the market fell below the neckline of the double top and reached a measured move down.
The correct way to trade a rally like this is to approach it with suspicion. Double tops are never perfect, and this is an example. Bears who saw that strong rally would begin shorting it once it reached the upper half of the prior bear leg. They place protective stops above the top of the bear leg.
Most traders should enter with stop orders. A bear could sell using a stop order to go short at one pip below the bear trend bar that formed at the top of the 7 bar rally. His protective stop is above either the sell signal bar, or just a little higher, above the lower high at 5:05 a.m. This is a low probability short. However, the risk is small and the reward is big so the Trader’s Equation supports the short.
Many traders prefer to wait for higher probability trades. One choice would be to sell the close of the big bear trend bar that formed 5 bars later. At that point, the bears had 6 bars down, with 5 being bear bars with closes near their lows. This is enough selling pressure to erase the earlier rally, given that the market was in a bear trend.
If a traders shorted here, his stop would be above the top of this leg down. The odds were that a rally from here would fail and the market would test down to this level again before breaking above the top of the bear leg. If the market broke to the downside, the bears would just ride it down for the measured move. This is what happened. If instead it rallied, many bears would have added to their shorts during the rally or as it failed and turned back down. If the rally was strong, many would simply get out at the midpoint of their two entries and give up on the trade. If the rally was minimal, some bear would exit all or part at their first entry, and hold the remainder for a swing down.
Other bears would wait to short until after the breakout below the neckline of the double top. This has the highest probability of success, but as is the case with all high probability trades, the risk is more (the stop is still above the top of the bear leg, or at least above the high of the breakout bar), and their is less profit remaining.
Swing traders would look for a reason to take profits around the measured move target. Since there was a sell climax down to the target, most bears would see this as a gift and exit one pip above the high of the reversal bar.
Aggressive bulls would see this as an exhausted bear trend with no bulls left who have to sell out of their longs. A big bear late in a bear trend is often an exhaustion gap, where the gap is the space between the close of the bar and the low of the prior bar. The market therefore had to go higher to find traders willing to sell. Bulls bought 1 pip above the small reversal bar at the low, looking for TBTL Ten Bars Two Legs up to the moving average and tight trading range. They saw that tight trading range late in a bull trend as the likely final bear flag.
Traders can see the end of the day Emini bar-by-bar price action report by signing up for free at BrooksPriceAction.com. I talk about the detailed Emini price action real-time throughout the day in the BrooksPriceAction.com trading room, and a 2 day free trial is available.
When I mention time, it is USA Pacific Standard Time (the Emini day session opens at 6:30 am PST, and closes at 1:15 pm PST). You can read background information on the intraday market reports on the Intraday Market Update page.


Hi Al,
Talking about forex, I think that on EURUSD weekly chart we can expect one more leg down because we had 3 pushes up and now is under MA.
But when I look at monthly charts I think that we can expect 2 legs up.
Can you please comment on EURUSD weekly and monthly charts and how they are connected.
thank you in advance,
Murat
Thanks for this Al! You know how much we love and appreciate your analysis of the fx markets too!! Any chance of hearing your thoughts on the current higher time frame charts of oil and the Euro pretty please?!