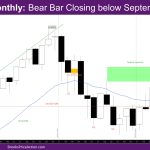
Market Overview: NASDAQ 100 Emini Futures The NASDAQ Emini futures October monthly Nasdaq Emini candlestick is a bear bar closing below September low with tails above and below. The week is a big trend bull bar closing back above the exponential moving average (EMA) and essentially reversing the bear bars of the last two weeks. The year […]
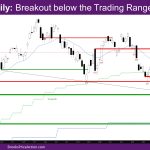
Nasdaq 100 Breakout below the Trading Range from June
Market Overview: NASDAQ 100 Emini Futures The NASDAQ Emini futures week is a good follow-through to the bear bar of 10/16, with a tail above and a small tail below. On the daily chart, this week looks like a breakout below the trading range from June. The monthly bar is now a bear bar with […]
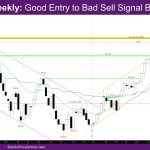
Nasdaq 100 Good Entry to Bad Sell Signal Bar of 10/9
Market Overview: NASDAQ 100 Emini Futures The NASDAQ Emini futures week is a bear trend bar closing on its low. It is a good entry to bad sell signal bar of 10/9. On the daily chart, the week had strong bear bars in the second half of the week. The monthly bar is an inside […]
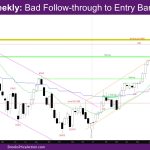
Nasdaq 100 Bad Follow-through to Entry Bar of 10/2
Market Overview: NASDAQ 100 Emini Futures The NASDAQ Emini futures week is a doji bar with a small bull body and a big tail on top. It is a bad follow-through to entry bar of 10/2, closing below last week’s high. On the daily chart, this went up to the high of 9/20 and reversed […]
Nasdaq 100 Entry Bar to the Reversal Bar of 9/25
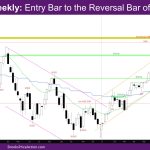
Market Overview: NASDAQ 100 Emini Futures The NASDAQ Emini futures week is a bull trend bar with a tail below at the weekly exponential moving average (EMA). It is an entry bar to the reversal bar of 9/25, closing above the high of last week. On the daily chart, this week looks like a trading […]
Nasdaq 100 Bear Trend Bar Closing above August Low
Market Overview: NASDAQ 100 Emini Futures The NASDAQ Emini futures September monthly Nasdaq Emini candlestick is a bear trend bar closing above August low with a small tail below. The week closed as bull doji reversal bar at the weekly exponential moving average (EMA), with tails above and below and close above the EMA. NASDAQ 100 Emini […]
Nasdaq 100 Second Leg Down from 7/31 Is Confirmed
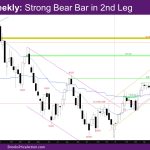
Market Overview: NASDAQ 100 Emini Futures The NASDAQ Emini futures week is a strong bear trend bar closing on its low approaching support at the weekly exponential moving average (EMA). The second leg down from 7/31 is confirmed. In other words, the first move down was from 7/31, and now the 2nd leg is confirmed. […]
Nasdaq 100 Three Pushes up from 8/18
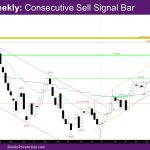
Market Overview: NASDAQ 100 Emini Futures The NASDAQ Emini futures week is a consecutive sell signal bar with its low above last week’s low. On the daily chart, this week looks like the 2nd and 3rd push of three pushes up from 8/18. The market tried breaking out above last week’s high and reversed. The […]
Nasdaq 100 Second Leg Down from 7/31?
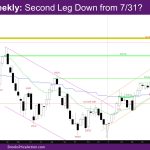
Market Overview: NASDAQ 100 Emini Futures The NASDAQ Emini futures week is a bear inside bar with a tail below. It is possibly the start of the second leg down from 7/31, when the first leg down started. On the daily chart, this week looks like a pullback from the breakout of last week. This […]
Nasdaq 100 First Pullback since March 2023
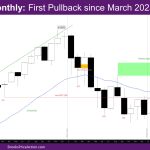
Market Overview: NASDAQ 100 Emini Futures The Nasdaq Emini futures August monthly candlestick is a doji bear bar with a big tail below. This month is the first pullback since March 2023 and the first bear body since February. The week closed as bull trend bar with small tails, closing above last week’s high. NASDAQ 100 […]
