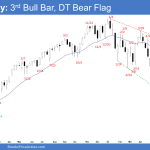
Market Overview: Nifty 50 Futures Nifty 50 futures double top on weekly chart with a strong bear bar closing near low. Still, the breakout gap is open which indicates some strength. Currently on the weekly chart, the market is near the trading range top so traders avoid buying this high. Nifty 50 on the daily […]
FTSE 100 tight bull channel and double top
Market Overview: FTSE 100 Futures FTSE 100 tight bull channel and double top on the weekly chart. On the daily chart it’s a small pullback bull trend so traders should only be looking for buy setups. But we have been in a trading range for over a year, and it looks most bullish at the […]
Emini futures double top bear flag, but strong leg up
The S&P 500 Emini futures tested close to the June 2 high. Bears want a double top bear flag, but the bull small bar on the weekly chart is a weak sell signal bar for next week. The move up since July 14 is fairly strong. Odds are the bulls will get at least a small second leg sideways to up after a pullback.
Nifty 50 measuring gap
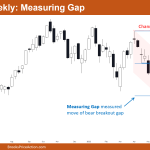
Market Overview: Nifty 50 Futures Nifty 50 measuring gap on the weekly chart formed another bull bar (this time a small one) and continued the bull micro channel after breaking above the bear channel (red). Currently, Nifty has achieved measuring gap and measured move target, so one can expect some profit taking at this level, […]
FTSE 100 double top pullback testing prior breakout
Market Overview: FTSE 100 Futures The FTSE futures market was a double top pullback testing the prior breakout. We have been going sideways for many weeks now so it’s a tight trading range ready to break out either way. The longer we go sideways the less steam the bears might have to push down further. The […]
Emini bears want breakout below double top neckline
Trading Update: Thursday July 14, 2022 Emini pre-open market analysis Emini daily chart The bears want a breakout below the June 30 breakout double top neckline (June 28 and July 8 high). Next, the bears would want a measured move down below the June 17 low. Bulls still want a double bottom high low major […]
Emini micro double top and double top with February 2 high
Trading Update: Friday February 11, 2022 Emini pre-open market analysis Emini daily chart An Emini micro double top formed over the past 2 days and a double top with the February 2 high. The Emini has been reversing up from a sell climax for 2 weeks. Yesterday rallied on the open, but then sold off […]
Emini higher high double top sell signal in late November
Trading Update: Tuesday November 23, 2021 Emini pre-open market analysis Emini daily chart Yesterday made a new all-time high but became an outside down day that closed near its low. It is a double top sell signal bar for today for a higher high major trend reversal. Last week’s range was small. This week might […]
Emini breakout mode with double top and double bottom on daily chart
Al added some comments Market Overview: Weekend Market Analysis SP500 Emini Breakout Mode with both double top and double bottom flags on the daily chart. There is a 50% chance of a successful bull breakout and a 50% chance of a successful bear breakout. The EURUSD Forex is in a 2 week tight trading range. […]
Emini double top bear flag forming after double bottom bull flag
Market Overview: Weekend Market Analysis The SP500 Emini futures market is in a trading range with both an Emini double top bear flag and a double bottom bull flag. There is a 50% chance that a 15% correction is underway. The EURUSD Forex has weak bear follow-through on the weekly chart. It should test the […]
