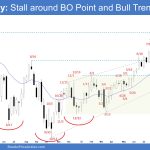
Market Overview: S&P 500 Emini Futures The weekly chart formed an Emini test breakout point; a two-legged pullback testing the February 2 high (breakout point) and the bull trend line. The bulls see the current move down simply as a 50% pullback (of the move which started in March) within a broad bull channel. If […]
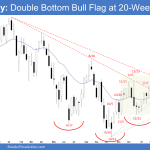
Emini Double Bottom at 20-Week EMA
Market Overview: S&P 500 Emini Futures The S&P 500 Emini futures formed an Emini double bottom at the 20-week exponential moving average. So far, the pullback in the Emini has gone sideways. The bears are not yet strong. The bulls want a strong breakout above February 2 high followed by a measured move up using […]
Emini Bull Reversal Bar
Market Overview: S&P 500 Emini Futures The S&P 500 Emini futures monthly candlestick was an Emini bull reversal bar closing near its high, reversing up from a double bottom bull flag (Dec 22 and Mar 13). Monday is the first trading day of the month. The market may gap up at the open, creating a […]
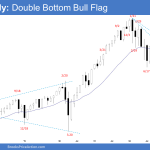
Emini double bottom bull flag but monthly close will be important
Weekend report co-author Andrew A. Market Overview: Weekend Market Analysis The SP500 Emini futures reversed up from an Emini double bottom bull flag this week on the daily chart. But it has been sideways for a month. Traders are waiting to see if August will have a bear body on the monthly chart. If it […]
Emini May double bottom bull flag neckline being tested
Emini and Forex Trading Update:Friday May 21, 2021 Pre-Open market analysis of daily chart Yesterday was a 2nd consecutive big bull bar, and a good follow-through bar after Wednesday’s strong reversal up from a double bottom bull flag. Last Friday’s high is the neckline of the double bottom bull flag. The bulls need closes above […]
