The support forum is built with (1) General and FAQ forums for common trading queries received from aspiring and experienced traders, and (2) forums for course video topics. How to Trade Price Action and How to Trade Forex Price Action videos are consolidated into common forums.
Brooks Trading Course social media communities
Hi,
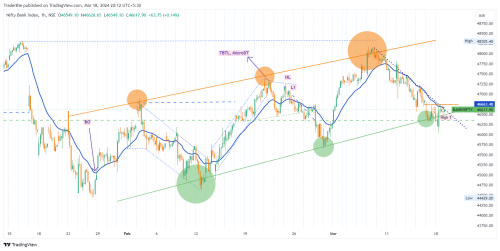
I have a doubt while trading a broader channel. While the market is in a bull channel with the third touch down to the trendline, How should one trade? Because after the third touch it breaks the trendline and goes down and that could be till the starting point of the channel.
AL also says that market has inertia and tends to do what it is doing and most reversal attempts fail.
Sometimes I find this term confusing, the reason being
1) when the market is in a broad bull channel it was the third touch on the trendline, if I just follow the above line does that mean I should be going long even though I know that after third touch there's likelihood of it breaking the trendline?
OR
2)Since the market is n a broad bull channel and it was the third touch on the trendline, so the current trend in that broad bull channel is a bear trend( from the third touch of trend channel line to third touch of trend line in which case if I just follow the above line does that mean I should be going short as it's a bear trend in broad bull channel?
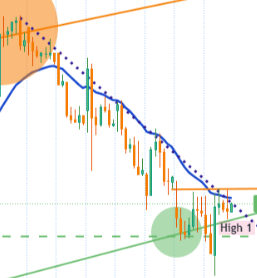
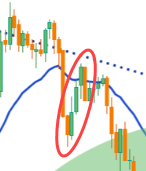
Below is a 1hr time frame chart with a broad bull channel, the current bear trend barely crossed the trendline yet with leg1 just touched the EMA and formed a high1.
Thanks
Hi Nandkishore,
I think the most immediate price action takes priority. So if currently in a bear trend then you'll be waiting for an MTR like with any trend before buying. Hopefully it will obey the HTF TL below and bounces near there, break the bear TL and do the usual failures to resume down and setup a good bull signal bar.
And since below is an HTF TL you probably want to avoid selling for a swing. Yes, it may resume the bear trend down but probably it will go flat for a while and give you more information if it's just a PB after bear leg and will resume down, or final flag and will reverse into bull trend.
These areas are indeed confusing since multiple timeframes are mixing here and the market is trying to transition, so probably will be a TR for a while. Whenever confused just step back and let the market figure it out.
One problem with focusing too much on HTF (like the big broad bull CH in your screenshot) is that if you zoom out too much it creates analysis paralysis. There are so many bars on this chart, you can find many good trades on the ways up and down in those legs without ever thinking about this broad bull CH. The trap is when to stop zooming out, 1H, 4H, daily, monthly chart? The higher TF you go the less it influences the intraday price action.
So at the very least, you might want to just avoid taking swing sells when near that broad bull TL, while still looking for a possible MTR if the bear leg breaks.
Hope this helps,
CH
________________
BPA Telegram Channel
AL also says that market has inertia and tends to do what it is doing and most reversal attempts fail.
Sometimes I find this term confusing,
When he says that, he means strong trends(BO) need to pass through the phases of market cycle to reach the equilibrium point from which the market decides whether it will get another bull trend or a bear trend.
By this, he also means that the market can keep on doing what it has been doing long enough that if you keep betting against what it is doing(for example, if you keep betting on a breakout of a TR, it will keep on failing long enough) - the market will in most instances outlast your account.
The wise thing is to always judge in which phase the market is in, and bet accordingly. If taking risky trades, wise to get out if you don't get fast follow-through.
1) when the market is in a broad bull channel it was the third touch on the trendline, if I just follow the above line does that mean I should be going long even though I know that after third touch there's likelihood of it breaking the trendline?
While it is logical to look for longs, despite it being a third touch of the trendline, when confused always go back to the basics. A bull channel(even if broad) is basically a bear flag. 75-80% chance that it will get a bear breakout. The 20-25% event is that the market gets a bull breakout above the bull channel.
You also don't take a trade based on a reason alone. You're looking for longs near the bottom of a bull channel but the market is in a tight bear channel like you mentioned. Does logic say that you should be going long yet? What does the market need to do to show you that the tight bear channel is no longer in play? It needs a bull breakout above, and needs some kind of DB or wedge or DB MTR type of pattern to convince that the bulls are taking control.
if I just follow the above line does that mean I should be going short as it's a bear trend in broad bull channel?
An interesting feature of a tight channel(here bear) is that it keeps getting strong bull breakout attempts near the EMA and then fails. So bears short near the EMA and have been taking profits at new lows, and the current bear trend resumption attempt at the bear trend line and EMA seems weak so far.
I would wait for stronger bear PA on smaller TF before going short. If bulls get BO above the tight bear channel, I would wait for the bulls to fail before going short again.
Feel free to ask questions, if there is lack of clarity or some typos crept in my response making some part of the answer unintelligible.
Thanks Mr. Carpet for such insightful information. I already did some mistakes 🙂 . I sometimes find it difficult to trade on 5 min TF since the moves are not very clear in such scenario where multiple TF are mixing so I tend to try to keep in mind higher TF trend (1 hr) and trade the 5/ 15 min. And also on 5 min I find difficult to get in and out unless I see the trend clearly.
In areas like this it gets difficult as you correctly pointed out analysis/paralysis while zooming out.
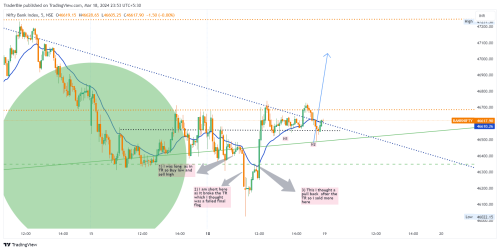
Also you touched upon the final flag which I saw in the 5 min chart but I saw it as a failed final flag. Taking a trade around the final flag is difficult as the flag can go in 3 directions.
Can you please suggest how to trade final flags /what signs to look for in a final flag ?
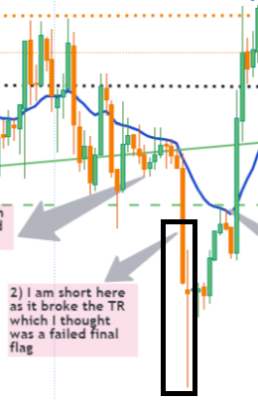
Here is the 5 min TF chart of the same and where I short sell which you already pointed out shouldn't have done that 🙂
On this 5 min chart after I saw a break of TR i went for a short trade prior to my first short trade I was long since in TR you Buy low and it was at the bottom 3rd of TR.
After it broke the TR I had a short trade and I even sold the pullback more since at the bottom of the TR I saw price rejections as AL suggests to buy/sell break of TR pullback.
I couldn't manage to get out of those trades and now since it's still in TR but on the higher side and looks like it will give upside break out of TR
Thanks
Agree about Al advising to sell BO PB out of TRs, and this was a tricky PB, but I think some hints of bullish strength were there:
1) it was a tight PB with many cc HLs and cc bulls, it reached resistance but because of such tightness it may be better to wait for 2nd entry to sell
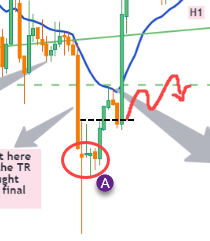
2) the last cc bull bars broke above a minor S/R (dashed line). It's not very apparent since it's a micro level but you can see that it was respected on the way down and became support. It doesn't mean never sell into this, but something to watch for if price gets stucks around such areas (especially after a BO+FT above it).
3) often after such a tight PB some traders might end up seeing it as a micro spike, so can expect at least 1 and often 2 legs after it (red). So even a 2nd signal may be too early and may need to wait longer.
4) The overlappy bars around (A) proved limit bulls in that area. This kind of formation is worse for bears than a PB like this:
In this PB trapped bears at the lows didn't have a chance to exit yet so they will probably scale in higher so can expect to find at least a scalp down as they seek their BE. But in your trade the overlaps and bad FT after the big bear BO would've allowed disappointed bears to exit early and wait for multiple legs higher before trying to sell again.
Thanks Abir that's was a very interesting explanation with some pointers you gave is going to very helpful for future trades and things to keep it in mind.
By this, he also means that the market can keep on doing what it has been doing long enough that if you keep betting against what it is doing
My problem is if I don't take an early trade and assume it breaks the trendline with a big bear body then I find it difficult to enter since my stop will be quite above that bear bar and then I don't' know if it will have a follow through candle or not like here
At one point that doji was good looked follow through it, there was a gap between the previous candle close and the open of this doji. If i would have waited for the doji candle to fully complete then by the time I would have lost the move since it was getting closer and closer to the resistance and i wanted to get out before that.
You rightly suggested there
If taking risky trades, wise to get out if you don't get fast follow-through.
But I find most of my trades are risky in swing, unless I take the take the 1st and 2nd, 3rd touch on the top of the trend channel line and 1st and 2nd bottom of trendline But these days I am taking less of MTR's trades since I have noticed that on a HFT they are just always pullback and the HFT trend continues.
Also let's say if the bulls get a BO here then it will be near the middle of a broad bull channel, If would enter somewhere in the middle then it can either go up and break above the channel or if bulls are weak then it could break below the trendline.
Sorry If I am not very clear in explaining on what I have been saying here that trades are always riskier for me.
Thanks I had failed to notice point you mentioned
So bears short near the EMA and have been taking profits at new lows, and the current bear trend resumption attempt at the bear trend line and EMA seems weak so far.
I would wait for stronger bear PA on smaller TF before going short.
Apologies didn't catch the abbreviation what is PA?
Thanks
Nandkishore
Thanks Mr. Carpet. It makes sense as to why the bears disappeared
Mr. Carpet, You mentioned in your very first reply
There are so many bars on this chart, you can find many good trades on the ways up and down in those legs without ever thinking about this broad bull CH.
Can you please explain few which one you were talking about?
Thanks
I'm not sure, what you were trying to ask here.
Apologies didn't catch the abbreviation what is PA?
Price Action
But I find most of my trades are risky in swing, unless I take the take the 1st and 2nd, 3rd touch on the top of the trend channel line and 1st and 2nd bottom of trendline
Not exactly sure I understood the setups you were talking about here but when I say risky - I mean setups that could very easily and quickly turn out to have poor trader's equation. Examples would be, buying above a strong bull bar in the top half of a TR or selling below a wedge in a small pullback bull trend and so on. Here, the context is dubious but has the possibility of turning in your favour if your assumption is right. So, if it doesn't turn out your way quickly - you end up trapped in a bad trade. Better to get out fast than letting your full stop get hit.
At one point that doji was good looked follow through it, there was a gap between the previous candle close and the open of this doji. If i would have waited for the doji candle to fully complete then by the time I would have lost the move since it was getting closer and closer to the resistance and i wanted to get out before that.
On the 5 minute chart, market was in a broad bear channel. In broad bear channels, you sell high and look to take profits at new lows. Also, the bear bar you sold on had the odds of turning into a classic 2nd leg trap(which it eventually did). If you short that bar, the only thing you can hope here is bears get strong breakout below the broad bear channel or the leg down would go far enough for you to make a quick few points. It was a momentum trade and not a value trade(normal swing setup). So, once the momentum is gone - I would get out of that trade.
To me, it feels like you're trading in a state of panic and confusion. It's a deadly combination.
But I find most of my trades are risky in swing
If you need to understand, what a good swing setup looks like - go and check out Al's past markup archives which has the blue box markings. It's a game changer. Pay attention to the blue box setups, and pay more attention to the blue box markups that worked well.
Hi Abbir,
Thanks for those answers
I'm not sure, what you were trying to ask here.
That was it, I later realised it actually but at that moment it didn't click 🙂
Not exactly sure I understood the setups you were talking about here but when I say risky - I mean setups that could very easily and quickly turn out to have poor trader's equation. Examples would be, buying above a strong bull bar in the top half of a TR or selling below a wedge in a small pullback bull trend and so on. Here, the context is dubious but has the possibility of turning in your favour if your assumption is right. So, if it doesn't turn out your way quickly - you end up trapped in a bad trade. Better to get out fast than letting your full stop get hit.
Thanks I understand what you are trying to explain. Well in this case the market did turn into my favour and gave a move down so I managed to get out with a decent profit but i was stuck for couple of days since it was in TR.
On the 5 minute chart, market was in a broad bear channel. In broad bear channels, you sell high and look to take profits at new lows. Also, the bear bar you sold on had the odds of turning into a classic 2nd leg trap(which it eventually did). If you short that bar, the only thing you can hope here is bears get strong breakout below the broad bear channel or the leg down would go far enough for you to make a quick few points. It was a momentum trade and not a value trade(normal swing setup). So, once the momentum is gone - I would get out of that trade.
To me, it feels like you're trading in a state of panic and confusion. It's a deadly combination.
If you need to understand, what a good swing setup looks like - go and check out Al's past markup archives which has the blue box markings. It's a game changer. Pay attention to the blue box setups, and pay more attention to the blue box markups that worked well.
That's is true it was a momentum trade since it broke the TR and I couldn't understand at that moment that it was a 2nd leg trap, I thought of a pullback after a TR.
Could you please help me out with the link to the archives, that would be really helpful? Is it in the encyclopedia of charts?
Thanks Nandkishore
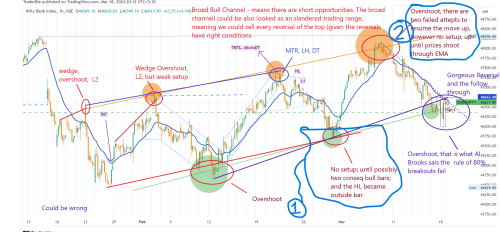
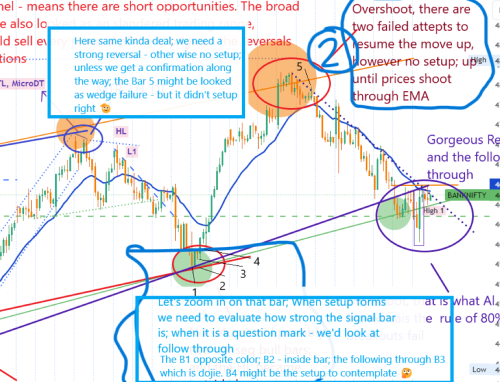
Thanks Mike much appreciated. Can you please explain point 1, I have highlighted in there is that because it's a V-shape reversal?
point 2 -> overshoot two failed attempts is that not enough to enter a short trade as Al says the market if it fails twice then it's going to do the opposite?
Thanks
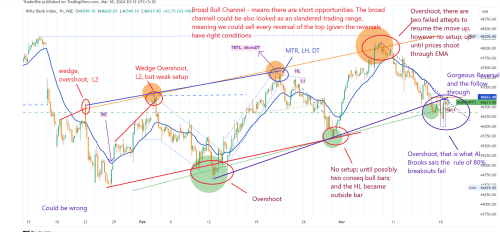
Nandkishore - check out the annotations (attached), every time setup forms we need the confirmation, it can come in the form of signal bar that needs to be with direction of the move and reversal looking. The next is thing is the follow through bar - if we don't get that - we don't enter setup no matter how it'll play out 🫡 ... those points 1 and 2 formed nice, but we didn't get signals. Could be wrong.
Thanks Mike, much appreciated
