The support forum is built with (1) General and FAQ forums for common trading queries received from aspiring and experienced traders, and (2) forums for course video topics. How to Trade Price Action and How to Trade Forex Price Action videos are consolidated into common forums.
Brooks Trading Course social media communities
March 16, 2024
Do not hesitate to comment and criticize.
Evolution from the first day: I switched to MES (from NQ). I removed the 10-second chart.
I keep trading the 1-minute chart for the moment to speed up learning.
This is simulated trading.
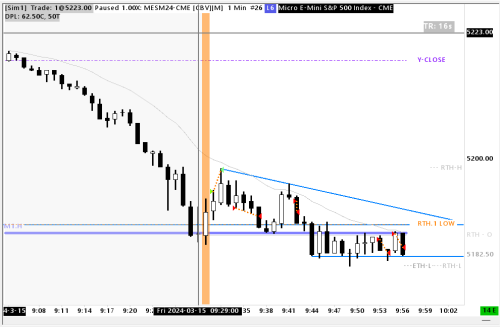
Green pair of triangles = long positions. Red pair of triangles = short positions.
Result: +50 ticks. 5/5 winners. Goal of 50 ticks reached.
Every single time I start trading a new method, I'm doing great the first few sessions before spiraling into chaos. So, these results are by no means representative of how I master BPA.
Trade 1:
Context: Always in short (from Premarket). But bull bar as first RTH Bar that is also a rebound on previous month's high.
Entry: Stop entry above that signal bull bar. Although the signal bar is a bit weak.
Exit: Selling climax starts from PM.
Trade 2:
Context: Always in short. I decided the first 3 not so good bull bars are forming a pullback in a larger trend started PM.
Signal Bar: L1.
Entry bar: Stop entry below signal bar.
Exit: A bit randomly and prematurely... I just got out prematurely instead of waiting for the return to previous month's high.
Note: when the trade went against me I was on tick from exit at a loss. I would have exited above L1 bear bar.
Trade 3:
Context: I decided we are now in a TR environment.
Signal Bar: Bear sell bar after a big breakout bull bar. Betting on BO failure.
Entry bar: Stop entry below the Signal bar.
Exit: Randomly; difficult to hold trade.
Trades 4 and 5
Context: Always in short, after the 2 large bear bars breaking below previous month's high. Tight trading range with strong upper limit that is RTH open and previous month high.
Entry: Limit order entries on top of the TTR.
Exit: Bottom of the range. Couldn't hold the last trade until bottom of range and exited prematurely.
Are you going to create a separate thread for each day? You wouldn't be able to track your evolution very easily then.
(And there'll be too many threads)
Best to have one thread and new posts for each day.
March 18, 2024
-92 Ticks loss
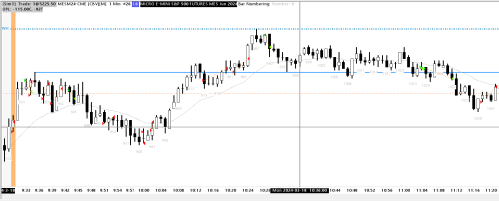
Green pair of triangles = long positions. Red pair of triangles = short positions.
The session turned out to be the chaos I mentioned in the previous post. I took an irrational losing trade in the first candle of the day, which triggered a chain reaction of bad scalp trades. I don't have the energy to comment on each trade.
I was hoping on L1s which didn't turn out good. I bet on TR and resistance against "Always in Long"... many mistakes in there.
On all these 14 trades, there is a SINGLE winner. On bar 961. Had I took opposite directional trades, I would have made a lot of ticks. This is always fascinating how easy it is to achieve a 99% losing rate.
Shall I decide to purposedely take opposite signal to what my system dictates, I will still achieve 80%+ losing rate. It's not the method that is problematic. The problem is with me.
March 19, 2024 +10 Ticks
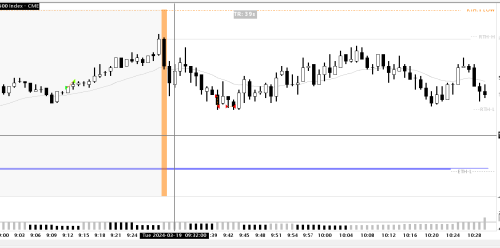
Green pair of triangles = long positions. Red pair of triangles = short positions.
After the catastrophic previous day, I decided to regroup around simple core BPA derived principles.
I decided to focus only on H1, H2... setups, as well as on unequivocal trading range reversals and discard ALL other setups. Scalp Exits with predefined target and stop.
The result:
3 Trades:
Two H1 (entering late on the first one) two winners. And a breakeven trade.
The trading environment for the first hour was bad, with very little conviction. I stuck to my plan.
March 26, 2024 +27 Ticks (live simulator)
Green pair of triangles = long positions. Red pair of triangles = short positions.
After a huge struggle with myself, I decided to switch to the 5 MN chart and look for swings instead of scalps only. I also decided to be more precise with my exits, which were a bit random.
I will go for at least 1x risk, and when possible will go for 2R, even 3R. For now, I always place my initial stop above the signal bar.
1) First trade was an H2 long in a very weak market premarket environment. Lost 1R.
2) Second trade premarket is a short: Break below trendline and MA. The always in long was not confirmed I think; this trade was a bit premature. Lost 1R.
3) Premarket Long: Now I felt the Always in was clearly short. So, I entered after a kind of L1, firmly decided to exit either when a profit target of 3R was reached, or when there was a bull always in flip signal, not necessarily a full confirmed bull flip. This turned out beautifully and the 3R target was reached, putting me into the green for the day. This is really the first trade I gave it some time to grow, and used the "Walmart" strategy.
4) Tight Trading range environment: BLSHS. I bought the breakout of the signal bar at the bottom of the range with a small target of 1R. The target was reached, but I panicked and exited prematurely.
5) Can't even tell why I took this long in the middle of the range.
6) Trading range BLSHS: shorted reversal from the top of the range with a target of 1R reached.
7) Last hour of this horrible slow day: Breakout of the low of day on big trend bars: strong AIS context. I jumped on the second strong bear bar as it resumed the down move with a target of 2R. I hesitated to go for a 3R target (which ended up being reached, even 4R was reached) but since there was not so much time until the end of the day, I chose the 2R. It was hit. Finishing the day up 27 T.
Altough I had more losing trade, respecting the trader's equation put me into the green. This is interesting.
Edit: 3) Was a short, not a long


