The support forum is built with (1) General and FAQ forums for common trading queries received from aspiring and experienced traders, and (2) forums for course video topics. How to Trade Price Action and How to Trade Forex Price Action videos are consolidated into common forums.
Brooks Trading Course social media communities
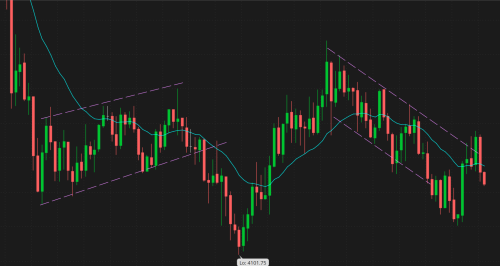
So the above picture is a trading range after a massive bear sell off today. Each candle is 5min. The problem for me was I didn't realize it was a trading range until much later.
I kept selling bottom and buying tops and following the channels.
What are your tips here? How can I tell if it's a trading range to change my strategy accordingly. And when I realize the TR, how can I tell if it's bottom or top to buy lo and sell high? Should I just stay out of the TR completely and wait until a clear BO?
It's only obvious after 9 hours of charts
What are your tips here? How can I tell if it's a trading range to change my strategy accordingly
Al explains the early signs of a TR in the video course. This is a core concept. When you have a problem with a core concept like this, I recommend going back to watch the related section in the course.
It's only obvious after 9 hours of charts
Once you understand the concept, you will see that this was not true. Think of it: If PA could not tell you early that you were in a TR, wouldn't it be useless?
Well I saw the overlapping bars and a few dojis with alternating bull and bear bars. Is that the sign? Because I thought it's just TR in that channel, and then breakout as you can see in the picture.
The breakout got reversed and then it channeled down again.
Only when I took a step back can I see that the whole thing was a giant TR.
Please correct me if I am wrong, and I am new to Al's teachings, but if the opening PA is 'big up, big down, big confusion - just an 2 bars or more, then that tells us the probabilities of a TR are high.
In your screenshot above, I see two reversals in 8 big bars, and many overlapping bars. Tells me its a limit order market and likely going to be a TR for a while.
Well I saw the overlapping bars and a few dojis with alternating bull and bear bars. Is that the sign?
Yes, this is TR PA so you don't sell lows nor buy high.
The breakout got reversed and then it channeled down again.
That is fine, if you sold above you exit your shorts or you open a long position.
Only when I took a step back can I see that the whole thing was a giant TR.
Yes, but in real-time you have signs of TR PA from the very beginning so if you sell high and buy low and you will be fine.
Please correct me if I am wrong, and I am new to Al's teachings, but if the opening PA is 'big up, big down, big confusion - just an 2 bars or more, then that tells us the probabilities of a TR are high.
The picture is not a session chart so this is not really the opening. But there were other signs, as you said.
In your screenshot above, I see two reversals in 8 big bars, and many overlapping bars. Tells me its a limit order market and likely going to be a TR for a while.
TR PA can be either a PB in a bear trend or a TR. The BO to the low failed so it became a TR but could have gone down as well (we don't see the context). Anyways, if you sold high you were fine in both scenarios.

