The support forum is built with (1) General and FAQ forums for common trading queries received from aspiring and experienced traders, and (2) forums for course video topics. How to Trade Price Action and How to Trade Forex Price Action videos are consolidated into common forums.
Brooks Trading Course social media communities
Guys I've been studying the course and brooks encyclopedia obsessively for almost a year now and I swair the one thing I still have no clear idea about is these ii, oo, ioi bars. I've watched the videos he has on them a number of times but I still just don't understand what they signify or how to use them. Do they essentially act as small flags?
Do they signify potential trend reversal? I'm just very confused.
I obviously understand the significance of like an outside down or outside up, however I don't really understand how to use the other ones.
Can someone briefly describe how they use them in their trading and what they look for them to signify? Thank you.
Do they essentially act as small flags?
This is exactly what they are.
Do they signify potential trend reversal? I'm just very confused.
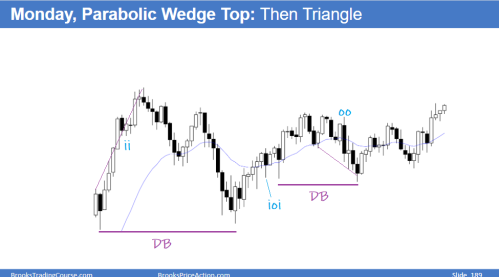
They are as any other flag, so it depends on the context. Last Monday we had ii, OO and ioi
The ii was after a Buy climax strong for a second leg up. Because ii are sideways flags they can be FF and it would be the 3rd push up, so you could buy for a scalp or hold and look for the reversal (this is what I did!). If you instead buy for a swing, you exit anyway below the Parabolic wedge SB closing on the low.
The ioi is a H2 in a bull leg coming from a DB, there is room to the top and the move up from the DB was tight with consecutives bull bars so it was safe to buy for a second leg up.
The OO was an ok swing sell but the move up from the DB was tight and the OO was the second push down so if a third came, especially at some support, better to exit. A DB with bull bar closing on the high formed, and the second leg (the one of the OO) was a wedge, so again better to exit. You can see this setup also as a big triangle or a DB PB so more reasons to exit any short.
So in this particular chart the first flag was an scalp, the second a swing that gave a small profit and the third a swing that gave a small loss... do this same analysis in any other chart and if you have questions, post them here and we can discuss them.
Anyway, if you have studied the encyclopedia, I recommend checking the daily setups because most of the time Al marks these kind of flags in them, so you can scan pretty fast this occurrences in their context for further learning.
Thank you. This was extremely helpful. I've been following the course now for about a year but i actually just purchased the encyclopedia like a week ago so i'm going to spend some more time studying it. Theres actually a lot more in it than i was expecting. The encyclopedia is liek a work of art.
I think what kind of confuses me is that they act as a flag but i also heard they act as a magnet, which from your illustration also looks to be the case because prices do seem to gravitate back to that area. So is it safe to assume that prices probably won't travel to far and more times than not you only want to consider a scalp, or is that not accurate?
Hi ludopuig explaind already all,
maybe it will help you to take a look how each of this patterns look like in a lower time frame to get a better imagination what the hack is going on there. Me helped this a lot and possibly it will click as well for you?
This was extremely helpful. I've been following the course now for about a year but i actually just purchased the encyclopedia like a week ago so i'm going to spend some more time studying it.
Yes, a lot of stuff there, especially useful if you compare the daily setups with the related sections of the encyclopedia.
I think what kind of confuses me is that they act as a flag but i also heard they act as a magnet
Yes, every flag is a magnet, but the context is what tells you if the price is likely to come back, so you can't deal with these patterns the same:
* ii usually act as final flags in trends so here you could expect a test down after the ii BO. Once the Parabolic wedge with good SB formed, very likely.
* The ioi was a flag coming from a DB so good for a swing. Bulls wanted a DB BO and MM up and, had they been successful, the ioi wouldn't have been tested but they failed.
* At the OO, the trending premise was now weaker: not trending so TR, in TRs price come back to entry prices, so here more likely the flag would be tested.
So is it safe to assume that prices probably won't travel to far and more times than not you only want to consider a scalp, or is that not accurate?
With the above in mind, not so, you need to read the context to make this decision for each of those flags individually.

