The support forum is built with (1) General and FAQ forums for common trading queries received from aspiring and experienced traders, and (2) forums for course video topics. How to Trade Price Action and How to Trade Forex Price Action videos are consolidated into common forums.
Brooks Trading Course social media communities
Dear All,
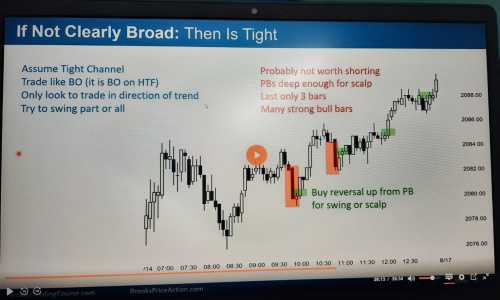
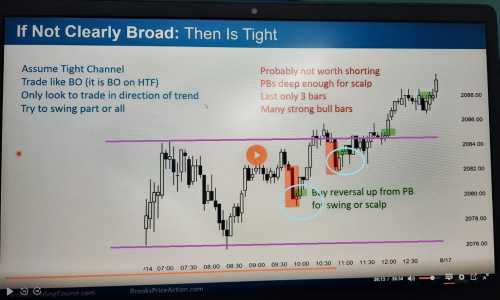
I have shared 2 charts. First one is the original one which I have captured from AL's video course and second one is the edited one where I have circled my problems.
I would like to have your explaination why it should not be considered as a TR. Also, at the circled areas where AL has highlighted to buy; I am viewing it as we are buying in the middle of a TR or in the sell zone (top third or TR).
Regards
Hi Harpreet,
This is definitely not an easy chart. I think some key ideas for this are:
- knowing what to expect next after one side fails majorly
- expecting reversal attempts to keep failing until the next ultimate target(s) is reached
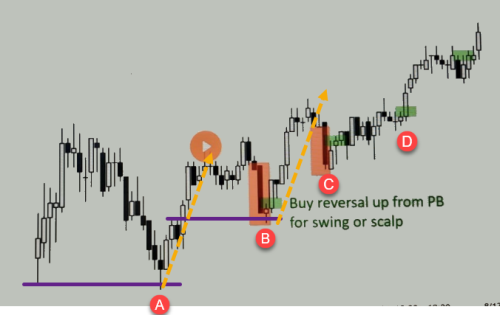
I think everything started with (A) where bears failed to break below prior major low.
It was already likely to become TR at (A) due to BUBD and unsurprisingly limiters came in. But when bulls produced a big leg >50% PB against the bears there was even more chance of this evolving into TR.
So if this will become TR, then after market failing at (A) it will probably head to top of TR next, so this sets the initial bullish bias and all trading is more likely to succeed with longs until the top of TR is tested.
Bulls produced leg 1 (yellow arrow) and started taking profits in upper 3rd of TR. They probably don't want to buy too high, but can expect them to enter more after a PB for 2nd leg attempt. In fact Al recommends to not buy BOs into top of TR with stops, but to wait for PBs to some BOP/support when trading in TR.
At (B) bears tried to reverse. But in TRs it's higher probability that strong pushes fail. And also (B) tested BOP/support (purple). So Al marked the next bull bar to take for a swing as it's small risk (stop right below for those who don't scale in) and strong push by bears more likely to fail.
There's still a 2nd leg up expected since in TR (yellow arrows).
At (C) it's a difficult one. Al is probably saying, if top of TR was really reached and it's starting to reverse back down, then bears need to produce strong cc bears. If not, they'll need to produce a LH. So at (C) bears failed to produce FT so Al marked taking buying the bull bar because at least a LH may still be expected so a little more up. But it's a difficult buy, agree. Probably just for a scalp.
(D) buy is easier, Al often marks such buys into top of TR to be taken for a swing, betting on huge BO to upside. Bears were failing multiple times to reverse down and market is creating cc HLs. It's becoming too tight to sell. Then a TTR near top of TRs is often a hint that some BO is coming. Also (D) is a small bar for small risk. So even if such trades fail multiple times, it will be ok overtime if able to catch the huge BO out of TRs (as happened here).
Hope this helps,
CH
_________________
BPA Telegram Group
Dear Mr. Carpet,
I am very thankful for your explaination. It is a problem which I have been facing for a long time. Really, you have not changed my perspective but in fact you have corrected it.
Thanks a lot again.
Regards
It's a difficult problem and this slide is difficult in real time. But Al used to mark many such swing entries in middle of TR on daily end of day reviews. If a TR is big and a bias to one side is strong then it's ok to try even in the middle. Otherwise a whole day can pass without taking any trades if a trader is waiting for top or bottom of TR forever. But for such trades also have to combine contexts like move needs to be tight enough so then reversals (PBs) can be expected to fail, and so on.
Yes, you are very true. Exactly same is happening with me. I just keep waiting and the whole day passes without having any trade because I only think we are in the middle of a TR.
Thanks a lot again Mr. Carpet 😊
Best Regards


