The support forum is built with (1) General and FAQ forums for common trading queries received from aspiring and experienced traders, and (2) forums for course video topics. How to Trade Price Action and How to Trade Forex Price Action videos are consolidated into common forums.
Brooks Trading Course social media communities
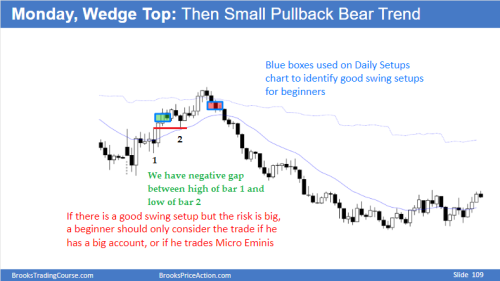
On March 14 2022, we had a fairly tight bull channel who seems small PB trend because it has a lot of trading range price action (many dojis and gap which I noted on the attachment file). Al has told that gaps and negative gaps and PBs who are less than 2x of average bar size, are the hallmarks for a small PB trend which is one of the strongest trends. Also, Al has told that in tight bull channels, markets is constantly creating wedges who are failing. So we have only to buy.
Why on this day, we have to sell at red box? Am I somewhere wrong? Maybe I have missed something
we had a fairly tight bull channel who seems small PB trend because it has a lot of trading range price action (many dojis and gap which I noted on the attachment file). Al has told that gaps and negative gaps and PBs who are less than 2x of average bar size, are the hallmarks for a small PB trend which is one of the strongest trends
Is it really a strong trend where there is a lot of TR PA? I can't recall the features(will have to refer to my notes which I can't at this moment due to some other commitments), but I do remember Al mentioning in his daily chart markups that SP trends don't last through the day, and a reversal comes within the day, typically around middle of the day(if I'm not too mistaken).
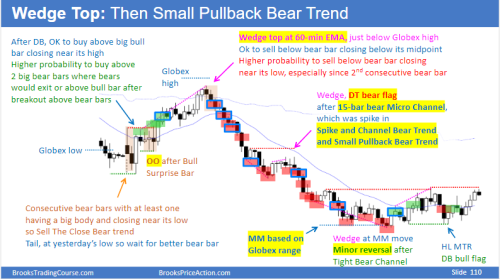
Anyway, there were two vital resistances that played a critical role in the reversal. First, the 60 minute EMA and second, the major high of the day before was around that level as well. A wedge top, near the major high, also a failed breakout of the 60 minute moving average - I thought it was the best swing setup of that day. I'm guessing many others did too, that's the reason the bars after the signal bar looked like that.
You can refer to his chat room notes as well if you didn't already. It might help.
Sorry for the half-hearted answer, it is due to some time constraints at my end. Hopefully, some experienced member would weigh in and help you out.
I see there were quite a few inaccuracies in my answer, now that I've had the time to revisit my notes. It is true that there were gaps between the breakouts and it is also true that the PBs were shallow and mostly sideways and were lasting 2-4 bars. However, the bull bars appear pretty strong to me. Also, the entire up trend mostly consisted of just 3 pretty strong bull bars which is not how SPBL trends look. I would not consider this as a SPBL trend. In a SPBL trend, the bull bars aren't supposed to look this strong. This is too climactic. So, in this case, I would consider the breakouts to be a climax where 3 consecutive climaxes created a wedge near two major resistances and hence the market reversed.
If you're not taking the sell on the first red box, you should get short once the Always In direction flips.
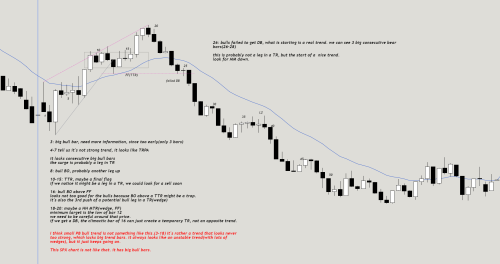
if you say 34-39 is also a TTR and there's a wedge at 44, and buy above 45, I don't know if it's best because of the small signal bar, but maybe it's not too bad, since that price is tested precisely afterwards. (forgot to draw a vertical line)
maybe you can enter with a wide stop.
Trading is still very difficult for me, because you can interpret the chart in many ways.
If you think bar 20 is not leading to an opposite trend, and the bull trend will come back later (hoping for a broad bull channel), I think you can actually hold. But after 25, failed DB, and 26-28 big bear trend bars, I think you have to get out. Actually, those who sold at 20,21 at first expected only a minor reversal(maybe to the low of 13) but they were lucky enough to get a failed DB and bear BO.
I think this is what Al means by "you can make money most of the time buying or selling."


