The support forum is built with (1) General and FAQ forums for common trading queries received from aspiring and experienced traders, and (2) forums for course video topics. How to Trade Price Action and How to Trade Forex Price Action videos are consolidated into common forums.
Brooks Trading Course social media communities
Hi, everyone!
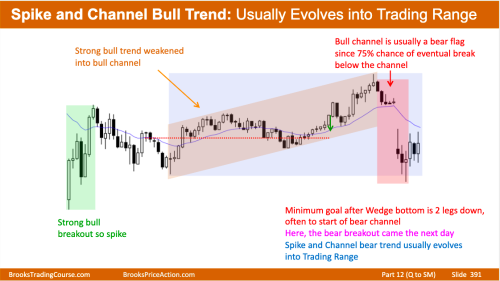
I'm going to write something that I identified on this slide and I'd like to see if my thinking agrees, so if anyone wants to give feedback I'll be glad.
On this slide, bars 1, 2 and 3 formed an spike, bar 4 was a pause bar and at this moment we could have the beginning of the channel soon, but we had another impulse, consisting of bars 5, 6 and 7. So, for me, we had a pattern of spike and climax.
It looks very similar to figure 21.4 from the Trading Price Action Trends book. In the book Al comments that when we have the spike and climax pattern, that is, consecutive climaxes are usually followed by a deeper correction, often to the bottom of the second climax (as occurred in the example of figure 21.4 in the book as well as occurred on the 46.1 slot.
I tried to upload both images for comparison purposes, but I don't know if they uploaded.
Thanks for listening.
It looks very similar to figure 21.4 from the Trading Price Action Trends book.
If you are referring to bars 1 and 2 in 21.4, yes, I would say it is pretty similar. The consecutive BOs are indeed part of a bigger spike and they are followed by a channel in the form of a small PB channel, in 21.4, and a channel, in 46.1.
Hi, Iudopuig! Yes, i was refer to bar 1 and 2 in 21.4..
Thank you for the answer!
Att
On the slide, I think if we go to a lower timeframe chart. It would look similar to Figure 21.4.
Though, for me, a beginner, I wouldn't look for short on the slide chart at 7, 8. The market is always in long so it's better to look to get long.

