The support forum is built with (1) General and FAQ forums for common trading queries received from aspiring and experienced traders, and (2) forums for course video topics. How to Trade Price Action and How to Trade Forex Price Action videos are consolidated into common forums.
Brooks Trading Course social media communities
Hi,
I'm new to Brooks Trading Course.
Currently, I'm trying to learn how to analyze price action with Daily Setups Archive.
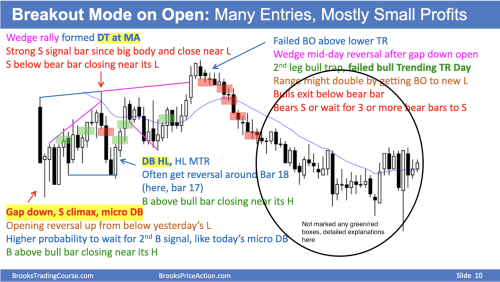
It seems that the right half of the April 9, 2019 chart (in Daily Setups Volume 1) is blank (not marked any green/red boxes).
But in the blog, it filled in the right half as well.
https://www.brookstradingcourse.com/analysis/market-update/emini-outside-up-buy-signal-bar-2900/
Does anyone know why it is blank?
Looks like Slide 9 is the blank chart before markup while slide 10 shows the analysis. All the days have the same situation.
Looks like Slide 9 is the blank chart before markup while slide 10 shows the analysis.
Sorry for the confusion, I forgot to paste its image.
Yes, slide 9 is blank chart and I use it to try my own analysis.
I think slide 10 is Brooks' analysis, but it shows boxes / explanations only the left side.
I checked this and the master file has same problem. Al must have forgotten to complete slide!!
I will update soon. Thanks for pointing this out.
...It seems that the right half of the April 9, 2019 chart (in Daily Setups Volume 1) is blank (not marked any green/red boxes)...
I have updated chart and found several other missing boxes on left-hand-side of chart!
All up to date now. Thanks again.
I can confirm the update, thank you!

