The support forum is built with (1) General and FAQ forums for common trading queries received from aspiring and experienced traders, and (2) forums for course video topics. How to Trade Price Action and How to Trade Forex Price Action videos are consolidated into common forums.
Brooks Trading Course social media communities
In the BTR Al always says if there is a big gap up (down) and the therefore the price is well above (below) the MA, then there has to be some pretty strong price action for him to buy (sell) on open, and that the usual criterion of two consecutive bars of the same colour, one being strong isn't enough. (this isn't anywhere in the course BTW, I only heard this mentioned in the BTR)
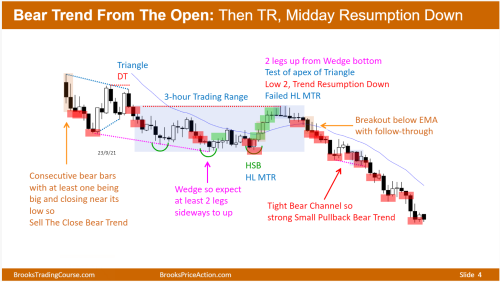
Yet, every day when there is a gap up or gap down, the daily charts are marked with "buy / sell the close trend from the open" if there are two consecutive bars of the same colour, one being strong.
See the most recent daily report for example. Yesterday the market opened with a 35 points gap down. The EMA was way above the price. Were the first two bars extraordinary? A 12-point range - OK, but nothing super dramatic. So was it a "sell the close trend from the open" or not?
The chart doesn't mention any extraordinary price action with regards to the first two bars.
This is really doing my head in. If the first two bars yesterday were something extraordinary, please could someone tell me what the definition of extraordinary actually is?
It was for me. But note day before ended in sell climax so sideways likely beginning before first 2 hours. I think brad noted that in premkt. Remember trading the open, things happen fast. Need to study past charts and determine your own specific rules. Unfortunately i was stopped out early yesterday. Trust me, it just happens
Sorry, nothing extraordinary…i meant mkt was a short below B2
Thanks, but my question was not about whether the trade would be a loss or not. My question was whether the trade would be the right trade or not, because there is a contrast between BTC and BTR. It's not about my research or my specific rules. The question is purely about what's right per BTC.
I'm assuming you're referring to "brooks trading room". Then I'd go with what's said in BTC. Remember Al has mentioned multiple times NOT to listen to others while trading (hence reason I'm not in trading room...too many distractions for me). You'll get many conflicting positions as different traders see different things. Also, Al scalps A LOT...for many wanting to swing (including myself), it can become confusing. Hope this helps. Good luck!
I know I keep going on and on about this, but in my view this really needs clarifying.
Big gap up yesterday, first two bars strongly bullish, but way above the MA. So is it correct as per BTC to buy above bar 2 or not? The daily setup suggests it's a valid buy, with the first two bars highlighted and buy arrows below bars 2, 3, etc. But anyone who's listened to Al for any length of time in the trading room knows that he always says buying way above the MA requires above-average bullishness. Do bars 1-2 show above-average strength? Why?
I honestly don't know why this isn't a burning question in everyone's mind... it's such a fundamental thing.
@Richard, would it be possibe for you to get this clarified by Al? Thanks.
FWIW, I find these types of incongruencies in the EOD charts consistently, and as a result do not use them for anything beyond the broad perspective they provide about a session's structure.
Hey PB,
The Brooks Trading Course (BTC) has at least one example of a Bar 2 entry in "Trading at Different Times of the Day" Video 48f, starting at 19:44 and specifically at 20:15.
And, the Brooks Encyclopedia of Chart Patters might have explanations for the Bar 2 entry arrows.
Regarding the discrepancies between BTC and the Trading Room, isn't the trading room geared for people new to trading? I've heard him say that more advanced traders might do things that they don't suggest in there. The charts might be suggesting entries for people who have been through the whole BTC so they can develop their skills.
I hope you are able to find a satisfactory answer to your question.
You should judge two consecutive trend bars on the open as a breakout. What needs to be considered is whether this breakout will be successful and get follow-through, or will it fail and quickly reverse. Noting the position of the bars relative to the EMA gives a clue to consider. If a breakout is occurring far above the average price (EMA), it may be climactic and exhaustion, particularly if it is running right into overhead resistance (if 2 bull bars). Looking to the left, at context, is important. You noted "there has to be some pretty strong price action for him to buy (sell) on open." The pretty strong price action to consider would not only be good looking consecutive trend bars with nice sized bodies and small tails on top (for buy), but also good context when looking to the left. For example, are we coming right up on resistance and this is likely a buy vacuum or are we breaking strongly through resistance with a higher probability of follow-through. If, looking to the left, the probability of follow-through for an adequate profit seems good enough, you could consider the trade. Context is the answer to your question.
Hi,
try to see the gap as one big bar up or down it might help when you do not use ETH and you are trading only RTH. Al is mentioning this somewhere in the BTC. That in context to the market cycle should always look like a BO of something when it is relatively big to the daily range.
When you look at points your mind could get confused like you wrote here
See the most recent daily report for example. Yesterday the market opened with a 35 points gap down. The EMA was way above the price. Were the first two bars extraordinary? A 12-point range - OK, but nothing super dramatic. So was it a "sell the close trend from the open" or not?
The context should be clear pre market to you so you should know what you have to do when the market opens. Try to create some what if's for yourself so you will be prepared for most of the possible market behaviors. There are many Pros who are waiting for at least 3 bars to see how the market starts, some are waiting for 6 or even more bars.
Big gap up yesterday, first two bars strongly bullish, but way above the MA.
This should mean for you gap up = spike > ch > tr in the market cycle context.
Use the previous day 5m PA or HTFs to consider where you are, which possible target bulls and bears might have for the day which you want to trade to get a better picture.


