The support forum is built with (1) General and FAQ forums for common trading queries received from aspiring and experienced traders, and (2) forums for course video topics. How to Trade Price Action and How to Trade Forex Price Action videos are consolidated into common forums.
Brooks Trading Course social media communities
We all know the theory, but I'm interested in hearing your experience with BO trading.
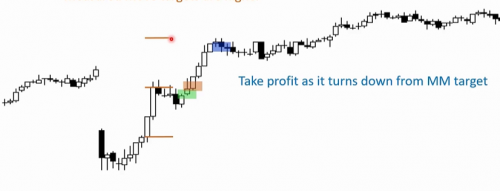
I have done extensive backtests and live trading over the years while learning Brooks PA and came to the conclusion that if you take every good BO (like image attached above) and go for the MM target based on BO candles bodies it is more 50-52% probability than 60% . Would you trade BO setups in a set and forget style, ie. either it hits your TP or SL you would not make money, at least in my opinion. So, I've found that it really is necessary to evaluate the follow through bars and if any disappointment try to get out with small loss or break even.
Interestingly, Al mentions he would place the stop below the BO low as an initial location but he would never let it get hit as he would exit based on PA.
This is consistent also with the rule: after a reasonable stop location is triggered (H, L, Wedge top, etc) the market has a 50% chance of reversing, meaning that after a BO, there's 50% chance it will fail, for example, if you break out above a previous lower high (as the image above).
What's your experience, is it really 60%? Or am I missing something?
Hi,
I'm still learning. But at this point, it's my understanding that there usually are multiple potential MM-targets. Along with other potential resistance and support levels. Anyone of those could become the point of reversal.
That's why you need to keep on reassessing price action.
I understand that there's a 60% chance that there will be more upward price action (in example above). And that price will continue to go up, up to SOME resistance. Sometimes that resistance might be the first potential resistance. Sometimes, many resistances will be broken until the market reverses, or makes a serious attempt.
It depends on the level of unanimity amongst traders/trading programs.
Depends a lot on the context. I'd say the likelihood fluctuates based on what has happened in the market so far, where it is relative to the prior day's range, etc.
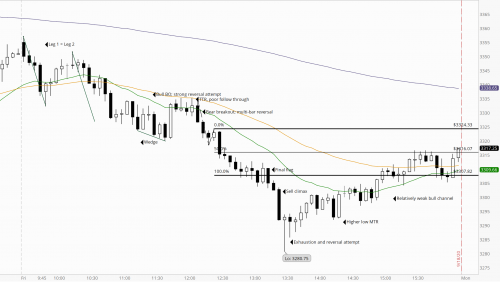
For example, if you look at the ES chart from today (9/18/2020), there was a bull breakout above a wedge bear flag at 11:45 (eastern time) and an attempt to reverse the trend. So in this context, is there a 60% chance of a measured move up based on the height of the bull BO bar? There's 2 major probabilities to consider in this case: 1. 60% chance of a measured move up from a strong BO and 2. 80% of reversal attempts fail. The follow-through helps determine which may be more likely to play out. The follow through bar was a small bear bar and then several more small bars right on the 20 EMA forming a tight trading range. The 12:10 bar was a strong bear trend bar closing very close to its low (part of a multi-bar reversal of the bull BO to resume the bear trend). Following that bar, there were two more bear bars. Given that the bull breakout failed and there were likely trapped buyers, the odds of a measured move down was quite high. Any small bounce up would likely be used by bulls to sell out of their losing positions and by bears who missed the first leg down since the multi-bar reversal to enter. In a case like this, I'd think that the odds of a measured move down are quite a bit more than 60%, but I don't have any backtesting to confirm that assertion (though I do question the usefulness of backtesting for discretionary trading to begin with since edges are unique and momentary), which is why I think the context is more important than estimations of probability based on what's happened historically. They do provide helpful guidelines to consider though.
The other thing to consider is how the measured move is actually being drawn. Is it based on the high to low of a leg? Is it based on just the range of the bodies in the breakout? Is the projection drawn as a 100% projection based on the size of leg 1 or is the pullback taken into account as well? So all of these things will also impact the probability of reaching a certain target. When it gets to the MM target does the market actually look like it's forming a credible reversal or is there a possibility that it will continue further? In this case, the market formed another trading range, the two bull bars had poor follow-through and a breakout below a bear bar after the second attempt up failed led to a final climactic move down. In such a case, it is difficult to try to project how much further it has the potential to go. All of this is to say that the probabilities fluctuate based on the overall context of what is happening in the market, how the MM is drawn, etc. so certainly use it as a guideline but as Marvin and Dr. Brooks also recommend, continually reassess what is occurring.
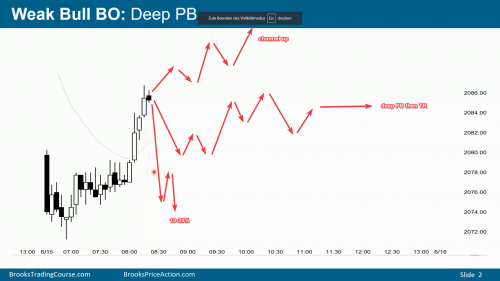
Yes, you guys are confirming my thoughts. Al says it often: there are 3 outcomes of a BO, 20% chance of an immediate reversal without DT/DB, channel up (BO continuation), or deep pullback which decreases the likelihood of bull trend, instead a TR is more probably. Good news is that 80% of the time you should be able to avoid a loss because if a deep PB follows you can usually exit at BE and if the channel up happens then you have a small or big profit.
Looks like trading a BO without careful trade management is not recommended.
Yep, always monitor any trade that you take for continuation. Look for information that both supports and contradicts your position and weigh whether the risk of continuing to hold is large enough to justify exiting. Any trade will have numerous potential outcomes to be assessing. For instance, in that chart that you just posted, based on the size of the first bear trend bar (the one all the way to the left) and the steepness of the EMA, the bull breakout could be retesting a prior high, at a 50% pullback, a leg in a trading range, and so on rather than the start of a new bull trend. Another thing to consider is the time axis shows that this is two different days of trading so it is possible that the market sentiment actually changed and the prior day's bears aren't that active in the market anymore. The bull breakout came after a very small and weak spike and channel below the EMA with the breakout coming out of that channel. Since a channel line break is an attempted acceleration of a move this may lead to a failure and reversal back into the channel within a few bars. The bars of the spike up also show some degree of hesitation (first large bar breaking above channel line and EMA has prominent tail on top, follow through is bull inside bar, third bar also has tail on top, fourth bar is a small bear inside bar as opposed to being several strong bull trend bars opening near their low and closing near their highs, forming gaps, etc.). So in such a case, rather than buying a close, it may be better to wait for a pullback to assess whether to get in or not. The pullback would give some reassurance that the channel and EMA below were retested (and for a broader range of participants that lower prices were retested and found buyers again) and it would potentially reduce the risk slightly.
In terms of avoiding a loss in 80% of cases, be careful about determining when it may be better to just take a quick, small loss and when it is reasonable to scale in as the position moves against you. Sometimes the better management decision is to just exit than to try to scale in and out so that you're free to move onto the next trade. Let's say the bars to the left showed a 100 point drop due to aggressive selling, would you still want to buy the close of that fourth bull bar, for example, and hold through a very deep pullback if it is reasonable to think that this bull spike may actually be a pullback in a stronger bear trend? Keep the market cycle in mind too. If we typically expect a spike --> pullback --> channel --> trading range, and the spike up isn't particularly strong, then waiting for the pullback is reasonable from that standpoint as well. So always carefully assess any trade that you take, monitor for continuation, and look for signs that you may be wrong since many of the most powerful adverse moves come when lots of people simultaneously realize that they're probably wrong and scramble for the door. Whatever trade you take, make sure you have a clear premise behind it so that you have a better idea of when the premise may no longer be valid. Also keep in mind that just because a position is exited doesn't mean it can't be re-entered.
excellent points
be careful about determining when it may be better to just take a quick, small loss and when it is reasonable to scale in as the position moves against you
this is where I'm still figuring it out, until now I never scale in instead I do as you suggest, if I see a 2nd signal (big enough, for example a DT) against my BO entry I just get out and if the PB looks weak or has bad FT I may reenter above a bull bar. The tricky part is assessing whether the BO has still some potential and you are killing a valid setup or if it's better to get out... You know, it sucks when you exit just to see the BO still playing out, a candle later.
Thanks! I've definitely encountered the same thing plenty of times and it is frustrating. There's a balance between being defensive in a position and allowing it to play out and it's something I'm also still continually working to improve at too. A key question to always ask yourself when you're considering scaling in is whether you're adding to a position to improve the probability of the trade, getting in at a better price, or you're adding onto a losing trade because you don't want to take a loss on the initial position. I've made the mistake of doing the latter enough times to know that's a stressful and expensive way to trade. Most good entries will be seen as good entries by lots of participants so they typically won't take too much heat.
In terms of making the call to close or keep a position in real-time, something that helps me is to consider the trade from the perspective of different market participants (subdivided into strong bulls, weak bulls, strong bears, weak bears) and trying to anticipate how these different time frame participants are likely viewing the activity. Using the chart that you posted as an example, we can see that there isn't significant interest to continue buying at highs as evidenced by the prominent tails and inside bars as follow-through during the breakout. Who has the ability to move the market? The strong, higher time frame participants rather than the day time frame participants. If we see that there are prominent tails on top of bull bars, then that can be indicative that the strong hand is viewing those prices as being too expensive so mirroring their activity and getting out because of the disappointing small bear inside bar could be justified since they may be waiting for a deeper pullback to start buying again. The weak hand would likely get out at the first sign of trouble too, so buying high has that added risk as well. It's also worth considering whether the other side is likely to see it as a strong enough signal to enter counter-trend.
If on the other hand, this had been a chart where the day had gapped up with several consecutive strong bull trend bars and very brief pullbacks, then it is more likely that there are strong, initiative buyers below. So in that case, if we think the pullback will be very brief with limited downside risk, then it can be fine to continue holding, potentially even scale in lower at what is likely to be a better price, etc. since we'd still likely be mirroring the way that the strong hand is approaching the current market context. There are always certain caveats (for instance, by gapping up the market is out of balance so there does exist the possibility of a very strong bear move if the higher prices are rejected by the market and strong responsive selling comes in) so there can't really be a prescription of "if x happens, do y" but taking a principles-based approach and continually reassessing does provide some good guidelines.
Another thing that can help to a certain extent is using correlated and inversely correlated markets and watching how they behave on a quote board. You don't need to watch multiple charts, just look at potential relative value using a broader market perspective by looking at percent and price change over time. If you've bought at a pretty high price, the follow-through bar is somewhat disappointing, but you see that the other indices are still moving up and treasury bonds, which are inversely correlated, are moving down, then it can be okay to continue to hold to see how the position continues to play out in your instrument. On the other hand, let's say you had bought that third bull close on that chart you posted with a bear inside bar as follow-through and you also see that the bonds are becoming less negative, then it would probably be safer to get out more quickly since it could be an early sign of a change occurring across the markets.


