The support forum is built with (1) General and FAQ forums for common trading queries received from aspiring and experienced traders, and (2) forums for course video topics. How to Trade Price Action and How to Trade Forex Price Action videos are consolidated into common forums.
Brooks Trading Course social media communities
Hello,
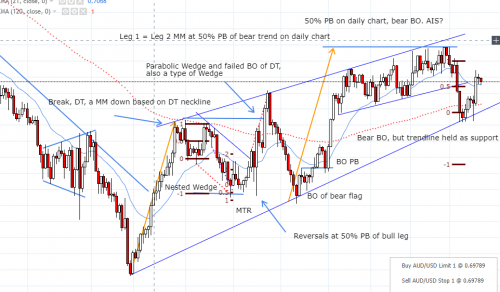
Attached is a 4 hour forex chart. I'll be trading Forex so as to trade the appropriate Don't Care size as well as using a higher time frame as I don't have free time during the day.
I have created notes on the chart. That is my analysis. I am 50% through the course and have been looking at all the charts I can.
If there are any suggestions, criticisms, etc. to help I would appreciate it. Please note that to the left of the expanding triangle there was a prolonged bear trend; that's why there's a reference on the right to a 50% PB on the daily chart.
Thanks,
TK
Hi Alekseyev,
All the remarks that you made in the chart could have been my own, so they seem logical to me. That doesn't necessarily mean they are correct! 😁
Are you in a trade? Or are you going to take one?
Silent Willie,
I appreciate the kind comments. I haven't converted to a live account yet. I am planning to do so soon. I've been marking up charts like this for months as practice. I've gone through the ancillary course that Brooks' admin has, Best Trades, and I've decided on trading pullbacks and Major Trend Reversals to start out with.
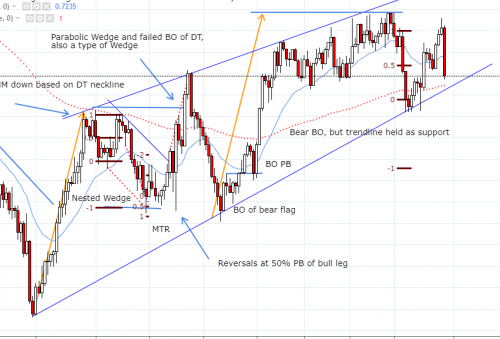
I've updated the chart. The initial bear breakout looked promising, but I thought the trendline I drew off the major higher lows might act as support. On the other hand, we were at a 50% PB and at a Leg 1 = Leg 2 MM, so a reversal was possible. I'm trying to navigate the art of discerning when a trade makes sense and doesn't work out and when it plain doesn't make sense. Even the highest probability we get there's room for failure.
To me, shorting the bear breakout, even at the trendline, makes sense considering the resistance we are at. I would have shorted that. You can see there was a reversal there. Got a double bottom High 2 buy setup that got a 2:1 RR out of. Turned into a wedge and we currently have a big bear bar. Might be a LH MTR. The bear BO and big bear bar after the wedge indicate more selling pressure. The channel has been broad, so it may just go into a TR.
Thanks for the comment!
Alekseyev
I agreed on all of your analysis, but couldn't quite decide wether to Buy or to Sell at that point either.
In my humble opinion, it would be best to watch what price does at the trend line. It might touch the trend line at the same time as it touches the grey/black horizontal line (which you've displaced and seems an important level to me).
So either clear BO beneath trend line(s). Or good reversal pattern, like at least a double bottom.
I'm still studying as well. So this is just the way I view it.


