The support forum is built with (1) General and FAQ forums for common trading queries received from aspiring and experienced traders, and (2) forums for course video topics. How to Trade Price Action and How to Trade Forex Price Action videos are consolidated into common forums.
Brooks Trading Course social media communities
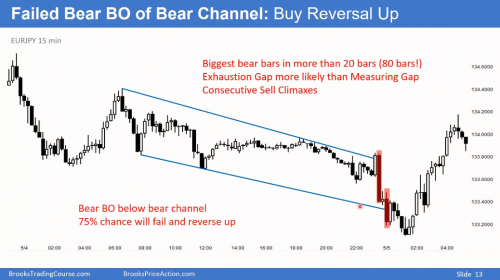
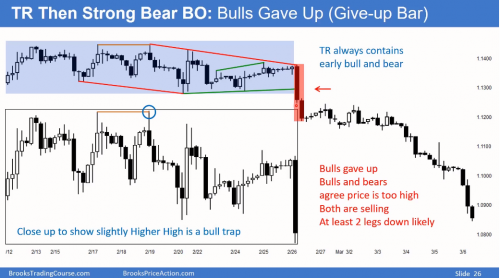
On this final slide there is a trading range followed by a bear BO bar. It’s described as a bull give up bar. However, earlier on in the video, in a seemingly similar context, a large bar at the end of a trading range is described as more likely to be an exhaustion bar.
Is there anything in the trading range itself that indicates whether a large bar at the end is more likely to be an exhaustion bar or the opposite?
Thanks
Hi John. I understand that exhaustion bars are normally the largest bars at the end of a move... at the climax of a trend. And these lead to a move either in the opposite direction or into a trading range depending on the context preceding it. Normally I understand its into some kind of trading range 80% of the time.
A Bull give up bar is precisely when the bulls give up and hence Bulls sell their longs and Bears sell... so the bar is quite large.
I would also like an answer from more experienced people. Great question.
@johnspl-realty-com You are right.
However, earlier on in the video, in a seemingly similar context, a large bar at the end of a trading range is described as more likely to be an exhaustion bar.
Not sure when earlier in the video you meant, but if it was slide 13 below the context was different.
In slide 13 you are in a bear trend (yes, lot of sideways PA but LH and LL in a spike and channel bear trend), hence the last surge is probably a climax, the trend is probably over and a TR or trend reversal will develop.
While at slide 26 is the opposite: you are in a TR and once the second bar confirmed the BO a new trend started.
s there anything in the trading range itself that indicates whether a large bar at the end is more likely to be an exhaustion bar or the opposite?
In a TR, you need the BO to be clear to everyone, otherwise, it will reverse. The first bar of the BO broke below the blue box and closed below but not much below, it was nor clear yet because most test of a TR extreme use to be strong to create confusion and trap traders. However, once the second bar closed also on the low and now well below the blue box, everyone was convinced that the BO was successful and could expect some kind of MM, therefore bulls exit and bears can sell. Yet, had the second bar been a bull reversal bar, it would have been a bear trap and a buy setup (similar to the bull trap shown in the slide).


