The support forum is built with (1) General and FAQ forums for common trading queries received from aspiring and experienced traders, and (2) forums for course video topics. How to Trade Price Action and How to Trade Forex Price Action videos are consolidated into common forums.
Brooks Trading Course social media communities
I would say yes but regarding the channels, you have drawn one in one but there are many others and you can't never know in real-time which one is really driving the price until late, so I don't know and I therefore I wouldn't place that bet in real-time. In the ES, trading the session chart with only 81 bars, I almost never use trendlines so this is the point in PA where I am weakest and maybe some other people can help on that.
In hindsight, it seems your trendline gave support to the price (for a while, at least). For my trading, as I told in other thread, I used instead the prior lows (TR day) and MM DT supports but the key is noticing that the MKT will not go much lower, not what particular support you use to do it, so if you make sense of trendlines and/or you see the PA better in real-time with them, good for you, they are a powerful tool!
This is confusing.
In an earlier post, we agreed this exact same setup had a 40% probability (selling 29L). In this post, it seems it is 70% probability.
This is confusing.
You are rushing too much, discussing PA components well before watching the dedicated videos, let alone giving yourself time for the theory to sink in. Hence, confusion.
n an earlier post, we agreed this exact same setup had a 40% probability (selling 29L). In this post, it seems it is 70% probability.
Different probabilities:
* 40% is for the swing short to reach a swing profit (not just to reach the closest prior low).
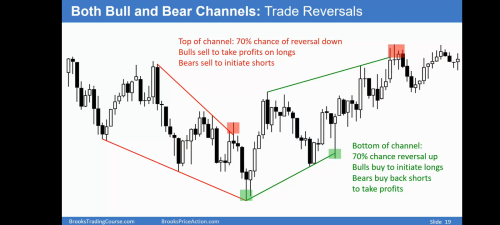
* 70% is for the MKT to turn down and reach the other extreme of a given channel (not any channel, as discussed, only if that channel is actually driving the MKT, something hard to know in real-time, at least for me).
In the ES, trading the session chart with only 81 bars, I almost never use trendlines
So how do you know the trends for S&R, it only starts with one bar.
In the ES, trading the session chart with only 81 bars, I almost never use trendlines
Hi @ludopuig,
Regarding your statement, I wonder if you use trend line for MTR setup? Cause I use it all the time a.k.a anticipating a MTR after a strong TL break so I feel like it’s one of the core thing. If you don’t, do you mind share what you use instead? Thanks.
In
ES, trading the session chart with only 81 bars, I almost never use trendlines
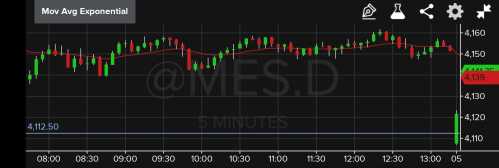
Is this a good BTC bar?
On the close, what is the expectation, what is the probability? Big Bar, Bigger Gap down. S&R line is yesterday's low.
Context looks like TR maybe TTR. 80% TR BO fail. Gap down= BO.
80% test of BO point? Maybe 60%?
Big down, Big Up, Big Confusion soon?
Regarding your statement, I wonder if you use trend line for MTR setup?
I use it and drew it for many years but now I have it only in my mind.
On the close, what is the expectation, what is the probability? Big Bar, Bigger Gap down. S&R line is yesterday's low.
If you buy there is for the MKT to come back to yesterday's TR
Context looks like TR maybe TTR. 80% TR BO fail. Gap down= BO.
Yesterday had a lot of TR PA. Today one huge trend bar, so the exact opposite of TTR.
80% test of BO point? Maybe 60%?
60% MM up based on the height of the trend bar. If next bar became another bull bar, I would say 60% for the MKT to reach yesterday's TR.
Big down, Big Up, Big Confusion soon?
No, so far only big down (the gap).
After first 2 Bull bars, if prior Day TR test is expected then why buy near the end of the move?
To expect something does not mean it is guaranteed to happen. It could go much higher or not reach it. If you buy high for a swing, you think it can go higher.
What is the trader's equation? What is the target?
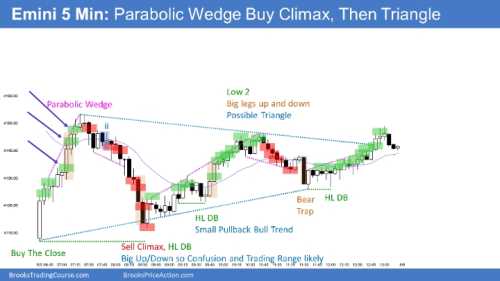
After a move like 1-11, the day either will be a bull trend day or a TR day, bear day very unlikely. This is the key to realize, and then two options:
1. It becomes a bull trend day reaching some kind of MM, like 1L-5H.
2. It ends up as a TR day: if so, even if you bought high, the MKT will probably come back and allow you to exit BE or with a profit.
And this second option is what happened, any buy-the-close trader entering from 1 to 11 and not exiting below any of the bear swing setups from 11 to 23 could buy more at 25H, 31H or 39H and exit without a loss.
Beginners should not scalp. Scalping needs a very high win%, is very difficult.
Beginners should look for 1-3 good swing trades a day with 1:2 risk: reward.
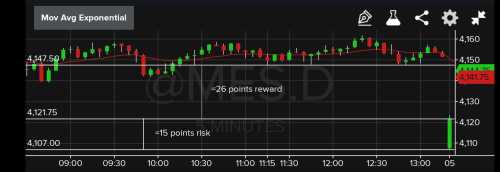
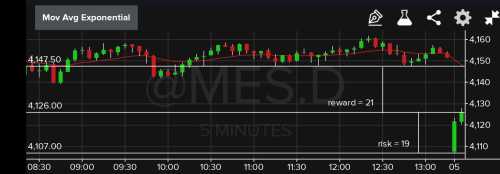
In the above example, BTC bar1 is targeting a 1:1 risk/reward for MM based on height of bar. BTC bar 2 is targeting TR above, which is less than 1:2 RR.
Is it ok for beginners to BTC on bar1 or 2 considering they a scalp entry? Both setups seem reasonably good for an easy trade with good exit plans.
Is it ok for beginners to BTC on bar1 or 2 considering they a scalp entry?
These trades are both scalps and swings so if a beginner takes them, Al recommends to manage them as swings.
So you shot for twice the initial risk and then you reassess bar-by-bar and, as long as you exit with twice the actual risk, you trader's equation is Ok.
you shot for twice the initial risk
The initial setup was BTC bar1 and target MM so 1x risk, actually less if the protective stop was below the bar.
Second choice was to wait for Bull bar 2 and target MM or TR (above) , risk19/reward 21 so about the same 1x Risk.
2x risk is close if BTC bar1 and target TR (above) ≈ risk15/reward 26...But still not 2x.
