The support forum is built with (1) General and FAQ forums for common trading queries received from aspiring and experienced traders, and (2) forums for course video topics. How to Trade Price Action and How to Trade Forex Price Action videos are consolidated into common forums.
Brooks Trading Course social media communities
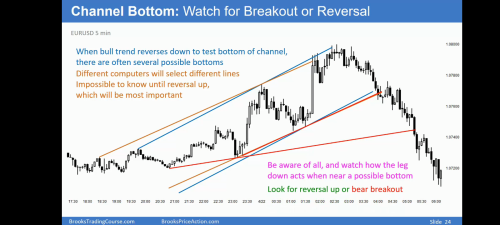
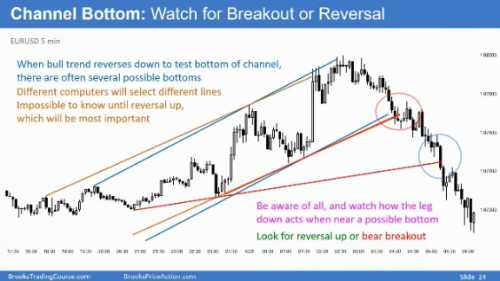
What is the lesson on this slide?
It is written in magenta in the slide: you need to be aware of the trendlines and watch if the MKT breaks down or reverses there. If the MKT breaks strongly you will likely get another leg down.
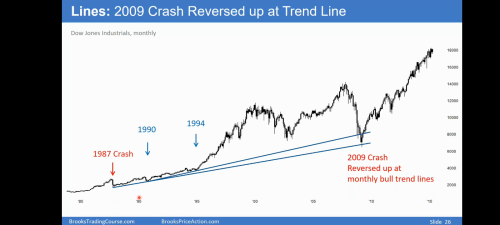
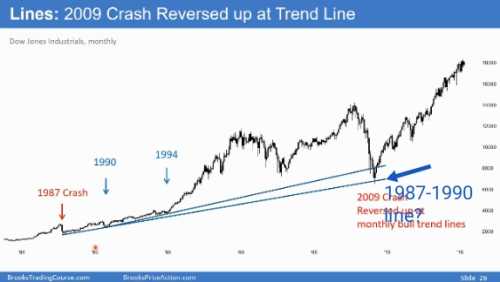
he slide title says "09 crash reversed at Trend Line" However, the line it reversed at was not created until after the reversal.
This trendline is formed with 1987 and 1990 lows.
The Trend Lines in both slides seem to give no support or resistance.
This trendline is formed with 1987 and 1990 lows.
The 1987-1990 line did not support the reversal. The lower Trend Line (1987-2009) can only be drawn after the reversal took place.
The Trend Lines in both slides seem to give no support or resistance
But the MKT just turned up at these lines, correct? If so, it was indeed a support, don't you think?
The lower Trend Line (1987-2009) can only be drawn after the reversal took place.
If you draw in your chartin SW a line using 1987 and 1990 lows, isn't it similar to Al's and turns out to be a support? If not, please, paste your chart!
In a bear trend many supports will fail but when the MKT finally turns up, it will do it at support. Hence, you need to be aware of all the supports on thew way down, like trendlines, prior highs and lows, MMs, etc., and watch whether the MKT stalls or breaking thru, like in this chart.
Exactly that: the two points used to draw this trendline are the 1987 and 1990 lows. The third touch that confirmed the trendine was the 2009 sell-off.


