The support forum is built with (1) General and FAQ forums for common trading queries received from aspiring and experienced traders, and (2) forums for course video topics. How to Trade Price Action and How to Trade Forex Price Action videos are consolidated into common forums.
Brooks Trading Course social media communities
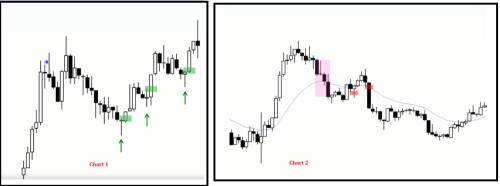
Both charts have about a 50% pullback in a bull trend. In Chart 1, Al mentions that traders will buy that pullback, especially opting for a second entry after observing a tight bear channel. In Chart 2, Al suggests that traders will seek to sell the reversal up after witnessing such a steep pullback. What is the major difference in those pullbacks between the two charts?
It is always about pressure and FT. Without both, a swing cannot sustain. Let me elaborate. Both are part of opening reversals, while the first one failed, the second one succeeded.
Chart 1 features
If you consider bars 1, 4 and 7 as a parabolic wedge(minor), the first reversal attempt was weak and failed. The second reversal attempt, which was a failed BO above a parabolic wedge had a bull sell signal bar, which you are obviously going to ignore. It followed an ii sell signal with conspicuous tails below the bear bars. The FT was mostly doji bars with lots of tails. The market never clearly became AIS. The result of a buy climax is 2 legs sideways to down. Here it was mostly sideways. It was unlikely, this would turn into a bear trend. The tails below bars form a microwedge and eventually reversed back up as the bears failed to take control of the market. A climax is a strong BO as well, so after the PB - the market would transition into a channel, here - broad.
Chart 2 features
The market had a steep BO, and therefore also a climax that was following a TR on the open(also, BOM). Since, the BO is following a TR - which is an area of agreement, the chances of reversal back into the TR increase if the BO following the TR fails. There is another pattern at play here - the market breaks out of the opening 18 bar range, but fails with a microwedge on the 19th bar and a fairly decent bear bar which would make me incredibly wary. The pattern is followed by 2 more reasonably decent bear bars(yes, there are tails) but the market is still not AIS. Bar 22 is an attempt by disappointed bulls who bought above bar 18 and opening range BO to exit BE which creates kind of a small DT. It is followed by 5 bear(?) bars, 3 of which are decent, closing near their lows and 2 pretty big. Here, the market turned AIS so we're looking to sell PBs(that is reversal up). The bear leg is strong enough to warrant a second leg sideways to down. Mind you, following the opening climax, we have had only a single leg down so far.
Thank you Abir for detailed explanation.

