The support forum is built with (1) General and FAQ forums for common trading queries received from aspiring and experienced traders, and (2) forums for course video topics. How to Trade Price Action and How to Trade Forex Price Action videos are consolidated into common forums.
Brooks Trading Course social media communities
Hello team,
I am a newbie and recently purchased Al's course. I am having difficulties clearly understanding concept of H1,H2,H3. From the lecture from the course I do understand that H1 is the first high of the bar that went above the high of the prior bar and High 1 Ends the first leg of sideways or down move. But I am having difficulties understanding how it has been plotted on the chart.
Can someone please explain with an chart image marked H1,H2 and explaining why it is H1, H2, H3
This question comes up repeatedly. So, please look up the material already discussed and available for all to understand better - Search – Brooks Trading Course Support Forum .
Hope this helps.
Hello team,
I am just trying to validate my understanding of H1, H2. I have marked the H1 and H2 and I have also typed my reasoning behind it. Can someone please go through this and see if my understanding is correct. Please feel free to write remarks/corrections on each of my comments on the chart.
Really looking for help on this.
Thank you!
Dear ludopuig,
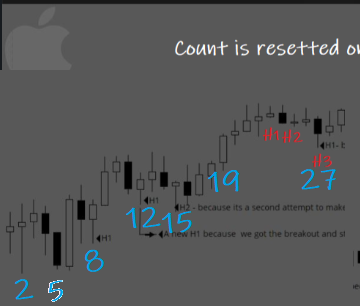
After studied around a year about AL's materials including AL's books, video course, blog emin analysis and the Encyclopaedia by AL, I'd like to verify my concept towards trading signal bars are reasonable or not. Please comment.
From the graph, I think bar 5 is high 1, but a bad signal bar due to it has a bear body with no tails. We should not place stop order and buy one point above the high of bar 5.
Bar 8 is a high 2, a not bad bull bar, however, the market is in a trading range. We can either buy the close of bar 9 rather than place stop order to buy one point above bar 8.
Bar 12 is a high 1, bar 15 is a high 2, but seems in a tight trading range and in a break out mode. I prefer not to take risk.
Bar 19 is a bull break out bar and I will buy the close.
Bar 27 is a bear bar and a bad H3. After the close of bar 28, I found out that the gap between bar 17 and bar 27 is not being closed. Bar 29 is a good bull bar and I will buy the close of bar 29.
Regards,
Steven Ma
After studied around a year about AL's materials including AL's books, video course, blog emin analysis and the Encyclopaedia by AL, I'd like to verify my concept towards trading signal bars are reasonable or not.
Tap yourself on the back for the commitment in following this slow but fruitful path!
From the graph,
Please, when discussing bars from a chart, include the bar numbers in the picture so it is easy to follow. If for instance looking at the post on the phone, it is impossible to read accurately and, anyway, I can make mistakes counting when there are many bars.
I think bar 5 is high 1, but a bad signal bar due to it has a bear body with no tails. We should not place stop order and buy one point above the high of bar 5.
In real time, 5 is a H1 from the top but also DB 2 and it is a bear bar closing on the low so LP. Once 6 OU bar forms, the DB 2 6 became stronger.
Bar 8 is a high 2, a not bad bull bar, however, the market is in a trading range. We can either buy the close of bar 9 rather than place stop order to buy one point above bar 8.
Bar 7 broke above the DB neckline so new top and bar counting resets. Hence, bar 8 is a H1 and a DB PB. The trigger of the signal is 1 tick above 8H, not at the close especially because we had a bear bar at a new H, so not strong for the bulls yet. Buying closes is ok on strength but here the BO had bad FT so not clearly trending and soon to buy closes.
Bar 12 is a high 1, bar 15 is a high 2, but seems in a tight trading range and in a break out mode. I prefer not to take risk.
Yes, ok to wait for a bar closing on the high for higher probability, but a H2 in a bull trend is a reasonable swing buy.
Bar 19 is a bull break out bar and I will buy the close.
Fantastic.
Bar 27 is a bear bar and a bad H3. After the close of bar 28, I found out that the gap between bar 17 and bar 27 is not being closed. Bar 29 is a good bull bar and I will buy the close of bar 29.
Agree!
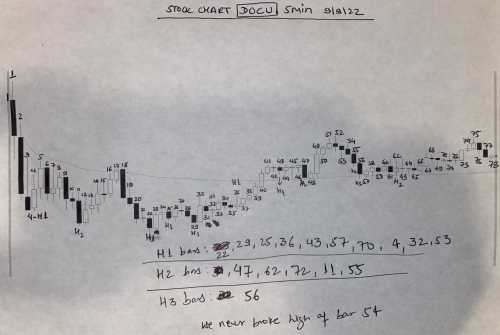
Studying again to have a clear concept on H1, H2 bars.
I have marked the number of bars that are H1 and H2's.
If I have made a mistake then I am still missing something in my understanding.
Kindly please mark proper H1's and H2's from bars 1 to 78 and please explain as you are explaining to a high school kid to understand this. I have watched videos 09A multiple times and I am just trying to understand this before I can move forward with other lessons with a clear concept.
Please Help!!
Image is Attached
I like to give short and concise answers but the question about bar counting is everywhere so I will try to give an expanded answer and analyze your chart thoroughly, trying to shed light on the issue.
I'll take a few days thru the incoming week trying to answer and not opening new questions. Wish me good luck!
Important, let's deal with this note as a work in progress, here comes the first attempt to clarify the issue to beginners.
Instead of analyzing the whole chart trying to give my best explanations, I have decided to share the analysis of the first bars so you can send me your feedback and let me know if it is really helping or I am completely off, so I try a different approach. If at the end we could all reach something worth it I would clean the thread and delete the feedback posts, once they were already taken into account.
A few other comments, in no particular order:
* I'll be doing a bar-by-bar analysis, trying to mimic what we see in real-time because this is what you really need to know. Bar counting in hindsight is different because some trades do not trigger and they are not marked at the end of the day but in real-time they are nonetheless legs within PBs (for instance, bar 1 to 3 or 6 to 11 are all H1s, but none triggered)
* The best way to learn bar counting, among other things, is following Al's bar-by-bar analysis available at the end of the day (in real-time for webinar attendees) in brookspriceaction.com. If you didn't do yet, go for it!
* Remember what is the goal in bar counting, it is counting the number of attempts within a PB before the MKT resumes, so you need a trend to be in place to start with.
* I will focus in bar counting, this means I will highlight all the H1...H4 and L1...L4 but I will not be saying anything about how to trade them, if they are strong or weak, etc. We are just counting in this post, not trading.
* Sometimes you can get slightly different readings but, as far as you don't lose sight of the goal in the previous point, the trading will be the same. I will give some of them but some others might be left out.
* I will mark the trades using the signal bar (SB), not the entry bar (EB).
* Sudeep Pandey, thanks for adding the bar numbers but, please, next time increase the font a little bit more so not only Superman at the age of 7 was able to read them without zooming 🙂
* The theory behind everything I explain can be found in the video course. Nothing new at all.
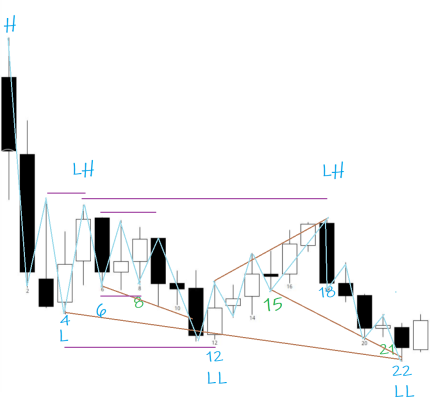
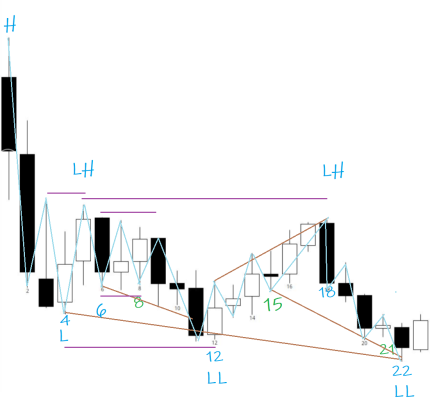
The key when counting is to notice that every bar is a high or low something (many times they are both: for instance, bar 4 is both a H1 and a L1), so you have to think always both in the bull and bear case. We have in this first set of bars one trend down from 1 and two small bull trends (= legs), from 4 and 12, so we are going to count them all.
Ok, here it comes:
3. Third consecutive bear bar in BO from the open.
4. H1 from the high of the day, bar 1, and opening reversal. L1 for the bears but bull bar.
I said that we need a trend up if we want to count legs within bull PBs, but before 4 the only move is down so, where is the trend? Because we are at the beginning of the day, and the MKT was high in bar 1 and now it is low, we use this high as if it was the high of a bull trend. This trend might exist (I can't see the bars to the left) and then this bar would be a different thing but for argument purposes lets consider only what we see, so bar 4 is a H1 (and bar 1 to 3 as well!)
Now for the L1, see the explanation in the picture below. The key, having clear the goal:
5. BO above the H1 but weak. Another L1 for the bears but also similar top than bar 3 so micro DT.
From 4 to 5 the MKT moved up, so now we have a trend down from 1, and a move up from 4. In this case, the move up is likely to be part of a PB in the move down but, no matter what we are looking for, we count for both sides the same.
6. H1 from 5 BO but bear bar and it didn't trigger. EB for 5 L1 or micro DT 3 5, both are traded the same.
7. Inside bar so another H1. Top of the bar around bar 5 so micro DT 3. If you saw the previous micro DT 4 5, then this would be a DT PB. It is traded the same.
8. Yet another H1 and its low is close to 6 low, so it is also a micro DB. DB and DT so TTR.
9. DT PB or TRI 5 7 9 or TRI 3 5 7 9. Bear BO of the pattern but closed above DB 6 8 so failed BO below DB is a type of Wedge and HL DB 4.
Remember that for bar counting, the type of the SB does not matter so 9 is a DB even though it is a bear trend bar. This does not prevent it to be a DB, it is only a bad DB.
10. For the bears, 9 is the BO of the DT 5 7 or the TRI and 10 is an inside bar so another BO PB and L1. For the bulls, F BO below DB 6 8 so again kind of wedge 6 8 10 and still HL DB 4.
11. Bear BO and new low. LL DB so H2 4, but bear bar.
12. Bad L1 at the bottom of the day. For the bulls, H2 4 but, even though no bar went above the prior bar from 5 (hence it is a microchannel), this second leg is also a Wedge 6 9 12 (three pushes down), increasing the probability.
13. ii, so breakout mode.
14. Weak BO from H2
From 12 we have a move up, so we start counting for the bull side and we are still in the big down trend, so we keep counting bear PBs as well.
15. Implied PB, so H1 (same than 9 and 10 but for the bulls). For the bears, DT 9 and DT 5 but doji and 3 bull bars.
16. BO for the bulls, DT 5 for the bears.
17. Same
18. OD bar trapping 17H bulls, DT 5. Move from 12 in microchannel is also Wedge 12 14 18 (three pushes up).
19. Consecutive bear bars so BO continues. H1 for the bulls.
20. Three bar BO from DT 5 18. Another H1 from 18 top.
21. L1. One more H1 for the bulls and around 12L so HL DB 12 and also truncated Wedge 4 12
22. New low: big Wedge 4 12 22 and last leg also a Wedge 15 21 22 or 19 20 22 (19 is a small bar after a big bar, so it is a pause, 21 is another pause so three pushes down).
Ok, let's see if this helps or hurts. Looking for your feedback with my fingers well crossed 😉
Excellent diagram.
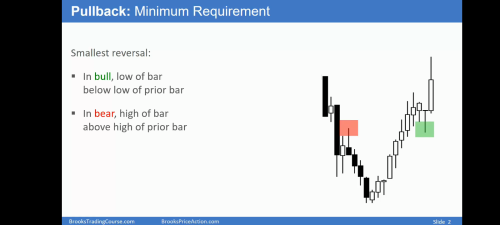
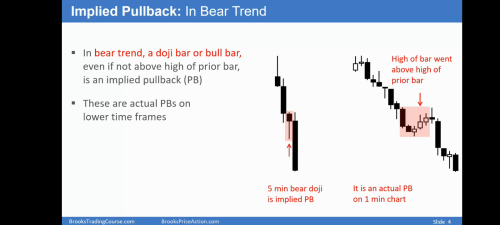
My understanding of PB in Bear leg= high must go above prior bar high. 09a slide 2
And 09a slide 4 implied PB. But is that really seen as an L1? To me that looks like a PB tail, but still a break out
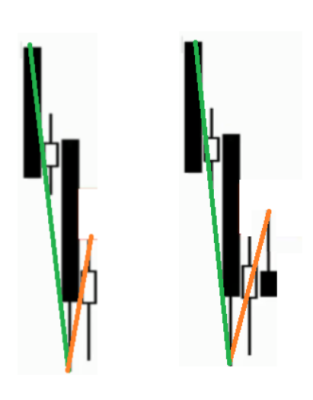
Forget for a moment about the need to go above prior bar's high and see the picture on the left: when the bull bar closes it is a pause (orange) within the bear trend (green). Correct? If so, it is a PB, a L1. On the right, once the bear bar closes (bar 5), it has just extended upwards the PB (orange line is longer) and, because there was not a new low, it is again a L1.
Same thing with the prior bull doji (bar 2). In real-time, you have bar 1 BO, and 2 is a pause or retracement, so this is a PB and a L1. If not, what else can be? Part of the BO, but it is a bull bar so it is not, it is actually the opposite, an attempt to make the BO fail.
But then bar 3 is another BO after the pause so you can now see it either as a two part BO (left-hand picture above) or as two different BOs with a pause in-between (right-hand picture), they are the same and bar 4 is the pause of this big BO or the second small BO.
Helps?
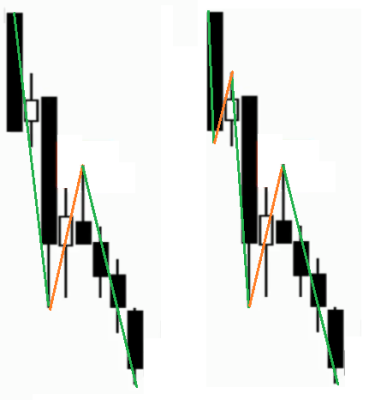
The blue line is a guide to help you see the path of the trend and its PBs, I am not measuring anything. The key here is to notice that 4 is a pause so a PB. I could have drawn from the low, like below in green but note that once the bar is closed, we don't know what path the price really followed, the blue or the green (or any other of the many possibilities in between), so it doesn't matter: bar 4 is a pause and a L1, this is what counts.
Bar4 pause is somewhat confusing because it's high/low are LH & LL with prior bar3, meaning continued downward progression. However, the open/close show a PB compared to prior bar3 open/close.
If bar4 was an inside bar (bull or bear), the pause would be more clear.
What is the complete definition, "Pause in Bear trend" ?
Bear trend pause can be 3 different situations:
1.Inside bar.
2.Open above prior bar close.
3.Outside bar: HH compared to prior bar (but also LL)
Bar4 pause is somewhat confusing because it's high/low are LH & LL with prior bar3, meaning continued downward progression. However, the open/close show a PB compared to prior bar3 open/close.
But see the picture again (I think you try to use strict definitions and doing so you see the trees but not the forest): looking at the blue or green line, do you see the retracement? I told you already that the SB type or if its low is slightly above or below the last bar doesn't matter...
If bar4 was an inside bar (bull or bear), the pause would be more clear.
Nop, same thing. The blue line would go up exactly the same no matter if the low of bar 3 is saved or it is below or above bar 3L.
What is the complete definition, "Pause in Bear trend" ?
Loose definition: the MKT was going down and for a while, during the pause, it is not going down.

