The support forum is built with (1) General and FAQ forums for common trading queries received from aspiring and experienced traders, and (2) forums for course video topics. How to Trade Price Action and How to Trade Forex Price Action videos are consolidated into common forums.
Brooks Trading Course social media communities
Do any successful traders not use bar counting?
For example, they recognize Pullbacks, double tops/bottoms, wedges, triangles, but they do not try to figure out H1,2,3,4,5 /L1,2,3,4,5
i do believe it is just a helpful way for traders to find pullback entries. It is not required though for me personally I like how it helps me easily name certain possible setups.
For example: Hmm there is a reasonable low 1 sell setup below a tight bear channel made up of strong bear bars closing on their low. This pause of the trend is more likely a pullback than a reversal, and any pullback is probably minor so I could take this low 1 sell setup.
Traders use bar counting as a way to measure pullbacks. In other words, Bar counting tells traders how long the pullback is lasting. Also, the stronger the trend/breakout, the more aggressive traders will be to enter in direction of the trend. The weaker the move the more traders will want to see a pullback.
There are many other reasons but yes, traders measure/use bar counting to find pullbacks
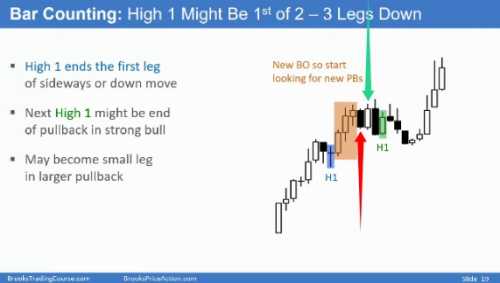
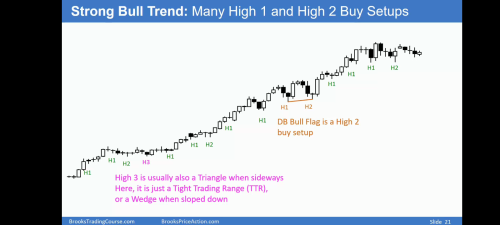
1. Regarding the looseness of the counting: what is the point of keeping exact count if there is no issue to skip over obvious pullbacks? (Example 09A slide 19> Red arrow= pullback. Green arrow= trend resumption. Not counted as H1)
2. Are implied Pullbacks/pauses counted the same as actual pullbacks?
1.5 What's the criteria for skipping a PB count
1. Regarding the looseness of the counting: what is the point of keeping exact count if there is no issue to skip over obvious pullbacks? (Example 09A slide 19> Red arrow= pullback. Green arrow= trend resumption. Not counted as H1)
Yes, the red arrow is a H1 but why do you say it is not counted as one?
2. Are implied Pullbacks/pauses counted the same as actual pullbacks?
Yes.
1.5 What's the criteria for skipping a PB count
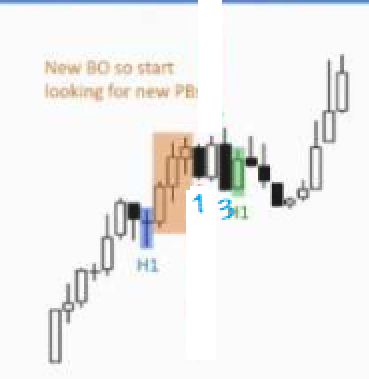
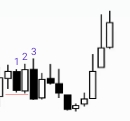
You can't skip but there are times un which you can count in several ways. This happens all the time: for instance in picture below bar 1 is a H1, as I said before. Bar 3 is a new high so bar 4 is another H1. Yet, you can see also bar 4 as a lower low Double bottom with bar 1, then it would be a H2 because all DBs are H2s. Therefore, bar 4 can be seen both as a H1 and a H2.
I am seeing ...
Bar 1-2 = H1
Bar 3-5 = H2
Bar 6-9 = H3
Correct counting. H2s are DBs, H3 are wedges.
Bar 3 is a new high so bar 4 is another H1.
Bar 3 is a new high, but also a new pullback low.
Maybe he labeled the green highlighted bar H1 because he considered all 4 bars to be one pullback ?
Bar 3 is a new high, but also a new pullback low.
Yes.
Maybe he labeled the green highlighted bar H1 because he considered all 4 bars to be one pullback ?
No. It is because this is what he needed to highlight for the explanation he was giving at that time. The 4 bars created a H2 PB, if you add the next 4 bars it would be a Wedge PB, but if he didn't mark that and only those two H1s is because he was explaining something else...
For consecutive H1s, doesn't there need to be a substantial breakout for separation?
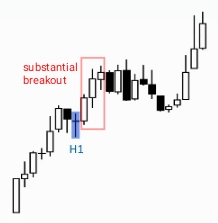
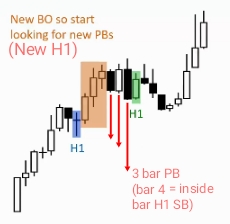
For example, the first H1 highlighted in blue is separated from the TTR bars by a substantial breakout, therefore resetting the H1 count:
The TTR bars have no substantial breakout, only a tick or two higher. Therefore in a TTR, how can there be anything other than H1,H2,H3 with no substantial breakout to reset the count?
Also, upon closer inspection, bar 2 is a PB from bar 1, therefore validating a single pullback from bars 1-4:
For consecutive H1s, doesn't there need to be a substantial breakout for separation?
No, just a new high.
The TTR bars have no substantial breakout, only a tick or two higher. Therefore in a TTR, how can there be anything other than H1,H2,H3 with no substantial breakout to reset the count?
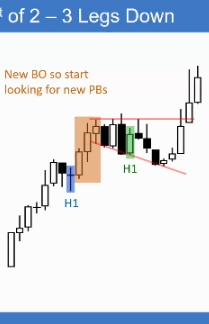
Don't lose sight that we are reading bar-by-bar even though we are doing so in hindsight when studying. See the left-hand picture below, both are H1s, no TTR, this came later. The first H1 broke out but the second evolved into a H2 (middle picture) and even then into a H3 (right hand picture) before breaking out. It is the usual MKT cycle, the first PBs (continuation patterns) are short (H1s) when the trend is strongest but following PBs need more time because the trend is then weaker, developing H2s and H3s, until one of them fail and become a reversal (failed continuation pattern) when the trend is weakest.
Also, upon closer inspection, bar 2 is a PB from bar 1, therefore validating a single pullback from bars 1-4:
Not sure about your logic but if it helps you doing the correct reading, fine!
Then why not label all pullbacks H1 ?
Because there is no new high, hence the counting goes on. Only after the breakout the count is resetted.
The reason for 1,2,3 is because they are linked closely together (complex pullbacks)
Yes, but...
1,1,1 pullbacks have separation by price or time.
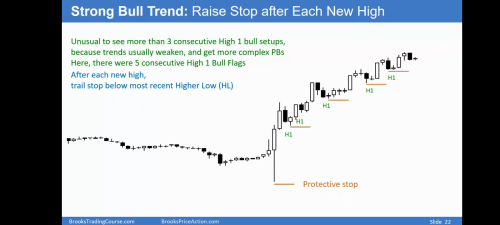
no: the only requirement for resetting the bar counting is to get a new high, the distance in price or time does not play any role in such labelling. Of course, it does have a big impact on the context: because consecutive H1s with good BOs in between (like the first one in the picture in blue) are signalling a strong trend (more than 3 consecutive H1s are rare, at least in the EMINI), while the back-to-back H1s forming the DB in the chart are signalling the usual weakening of the trend.
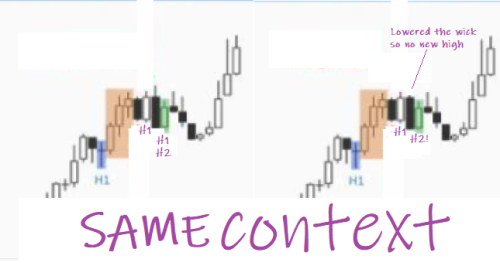
See the picture below in which I have modified the OU bear bar in the right-hand picture. Yet, the reading is exactly the same once the second violet H1 has disappeared: a H2 in a bull trend.
