Monthly Forex EURUSD candle chart: Strong bear breakout below head and shoulders bottom
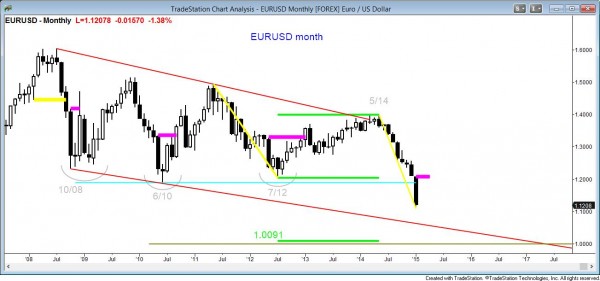
The monthly EURUSD Forex chart is in a strong breakout below a head and shoulders bottom. A failed bottom usually falls for at least two legs and it typically reaches a measured move projection.
The monthly Forex EURUSD candle chart is breaking strongly below the trading range of the past 6 years. The current month is the breakout bar and it is a big bar with a close on its low. There is still a week before the bar closes, and it will look very different when it closes if there is a strong reversal up this week. However, when a breakout bar is as big as this, the odds are that the first rally will be sold and there will be at least one more leg down.
When the bar is this big, it usually traps bulls in and bears out. When a market is in a trading range, bulls buy around the bottom and scale in lower. Bears sell near the top and scale in higher. Both look for quick profits, and often exit around the middle of the range. Here, there is a big bear breakout. The trading range bulls bought near the bottom of the range and they scaled in during the early stages of the breakout. They now know that this is a losing strategy and that the market has evolved from trading range price action to strong bear trend price action. They have to change their style of trading to fit this new part of the market cycle. They are hoping for a bounce so that they can sell out of their longs with a smaller loss. This is overhang…there are bulls who are looking to sell a rally. If a market is to trend up, it needs bulls to buy rallies and buy more higher. If instead the bulls are selling rallies, there is usually at least one more leg down.
Rallies are always tests of resistance. When there is an exceptionally big bear breakout like this, many bears will place protective stops 1 pip above the top of the breakout bar, which is this month’s high. They know that a more reliable place for a stop is above the height of the current bear leg, which began in May, but that is too far away and most traders will not risk that much.
Everyone knows there are lots of buy stops above this month’s high. Look at the big bear bars in October 2008, May 2010, and May 2012. Each formed late in a bear leg, and each was followed by a reversal up that went above the top of the bar. The opposite was true for the pair of big bull bars in February and March 2008. The reversal down fell below the bottom of those two bars, which means that they formed an exhaustion gap.
When I say gap, I always mean any space between support and resistance. Sometimes that is a conventional gap where there is a space between consecutive bars, like a gap up or down on the open on the daily chart of a stock.
That is not the type of gap I am describing here. Instead, this particular gap in this bear trend is the space between the close of each bar and the low of the prior bar. When there is an exceptionally big trend bar or pair of trend bars late in a trend, it is more likely an exhaustion gap than a measuring gap. When it forms early in a trend, it is more likely a measuring gap than an exhaustion gap. This current month is a big gap bar, and it will probably lead to a measured move down. There are actually two gaps. Its close is far below the support of the bottom of the trading range, creating a gap between the close of the bar and the bottom of the range. There is also a gap between the close of the bar and the low of the prior bar.
Everyone also knows that a big bar like this is climactic and the odds are that there might be a rally soon that might test the breakout point. That point is the bottom of the trading range, and it is also around the top of the current bar. However, because this breakout is so big and traders are so confident of lower prices, the breakout might continue for several more bars before there is a pullback, and the first pullback might not reach the bottom of the trading range above.
There are also bears who did not sell the breakout. These trading range traders were only selling near the top of the range. They now see that the market is no longer in a trading range and they want to find a way to get short. They are hoping for a pullback from this bear breakout, and they will sell that rally. The would like to sell a reversal down from a rally so that they can use a tighter stop and therefore risk less money. Since both the bulls and bears are desperate to sell a rally, the odds are high that the first reversal up will be brief and it will be followed by at least one more leg down.
Weekly Forex EURUSD candle chart: Sell climax and an exhaustion gap
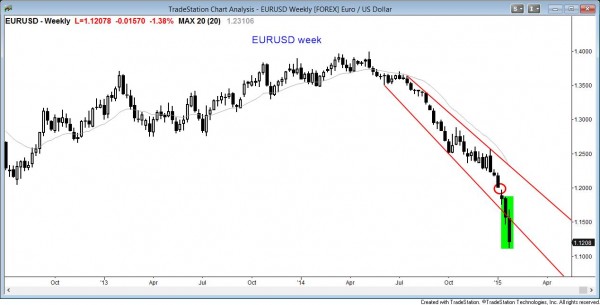
The weekly EURUSD Forex chart formed the biggest two consecutive bear trend bars in a trend that has lasted 30 bars. This is probably an exhaustive sell climax.
The weekly Forex EURUSD candle chart is similar to the daily chart. It has the biggest consecutive bear trend bars in a bear swing that has lasted a long time (more than 30 bars). Although this might be a measuring gap, it is more often an exhaustion gap. The market usually tries to reverse within a few bars and then test at least 1 pip above the high of the first of the two bars. This is an area where bears typically place protective stops and it is therefore a magnet.
When there is a big sell climax like this, bulls begin to buy near the bottom of the bar (this week’s close) and risk a measured move down, betting that it is more likely to go above the top of the two bars before it falls that same number of pips lower. Do not take this trade. When the channel down is as tight as this, the first reversal up usually does not reach the bull target, and instead leads to at least one more leg down. That leg down is usually another sell climax, and it sometimes is even bigger. However, that small rally would be buying pressure and it would increase the chances that the next rally might go further up.
The only trade for most traders is to sell for any reason, like at the market or during a small rally. To buy, they need to wait to buy for many bars. The bulls need to see some significant buying pressure before they will trust a rally. This is true for bulls who are inclined to buy the close of a sell climax, looking for a rally to the top of the climax (the high of 2 week’s ago). Most will not buy this particular close because the channel down is too tight. This means there is not enough buying pressure for them to buy yet.
The first rally will probably be sold, and the bulls will probably need a major trend reversal before any significant leg up can occur. They would probably need at least 10 – 20 bars (weeks, since this is a weekly chart) to create that much buying pressure. Until then, the EURUSD is still in a strong bear trend and bulls will only look to scalp, and bears will swing trade and sell every rally.
Daily Forex EURUSD candle chart: Big sell climax and exhaustion gap
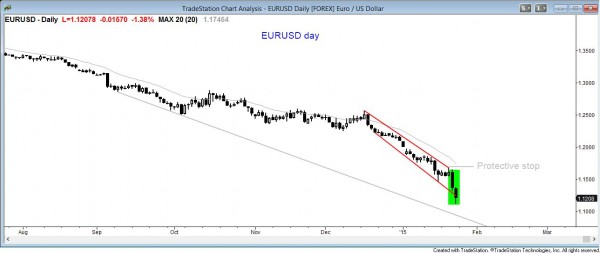
The daily EURUSD Forex chart, like the weekly chart, has the strongest pair of consecutive bear trend bars of the trend, and they are forming late in the trend. This is more likely an exhaustion gap than it is a measuring gap.
The daily Forex EURUSD candle chart is similar to the weekly chart, and it also has a pair of big bear trend bars. These are more likely to become a small exhaustion gap than a measuring gap. There is more buying pressure on the daily chart than on the weekly chart, so bulls who like to buy the close of a sell climax are more likely to buy Friday’s close, looking for a test above the top of the two day sell climax. However, most traders should only be looking to sell rallies, like to around Thursday’s high and the moving average.
Example of Forex EURJPY day trade from this week: Strong bear breakout on 5 minute chart, sell closes for swing trade
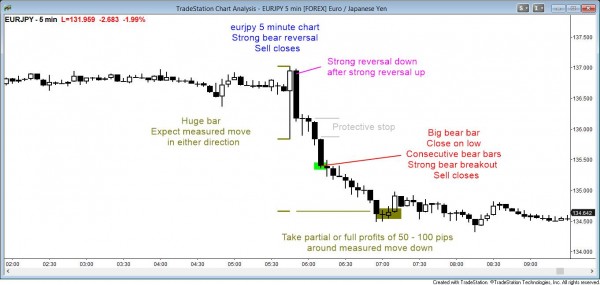
The EURJPY 5 minute chart had a big bull reversal bar, but the market immediately reversed strongly down and fell for more than a measured move down, based on the height of the bull bar. Once traders saw the bear breakout, especially with consecutive big bear trend bars closing near their lows, they became confident of lower prices. The probability was high enough for them to assume the big risk needed (the stop is far above) to take the trade. They began to sell closes, looking for about a measured move down. The stop is one pip above the top of either of the two strong bear trend bars.
Traders can see the end of the day Emini bar-by-bar price action report by signing up for free at BrooksPriceAction.com. I talk about the detailed Emini price action real-time throughout the day in the BrooksPriceAction.com trading room, and a 2 day free trial is available.
When I mention time, it is USA Pacific Standard Time (the Emini day session opens at 6:30 am PST, and closes at 1:15 pm PST). You can read background information on the intraday market reports on the Intraday Market Update page.


