Monthly S&P500 Emini futures candlestick chart:
Probable bear month
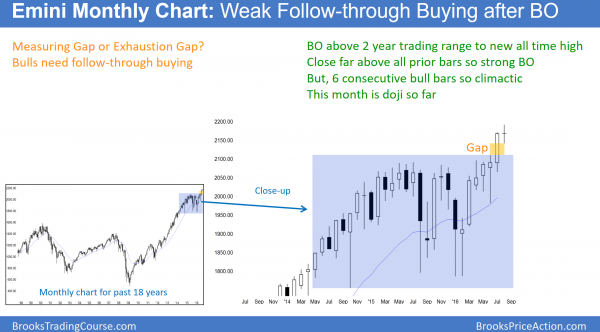
The monthly S&P500 Emini futures candlestick chart has 3 days left before the bar closes on Wednesday. It is now a doji candlestick pattern in a 7 bar bull micro channel. That is a buy climax and the odds favor a 1 – 3 bar (month) pullback.
Because the Emini monthly chart has had 6 consecutive bull trend bars, which is unusual, it is in a buy climax. Therefore the odds are that August will have a bear body. That does not necessarily mean a big bear reversal bar. All that the Emini has to do is close below the 2168.00 open of on the month to create a bear body.
A bear close on the monthly S&P500 Emini futures candlestick chart in August would then create a sell setup going into September. Yet, after a 7 bar bull micro channel, the reversal down will probably be minor. Hence, it probably will last a bar or two (month or two) before the bulls buy again. Due to a 2 month, 100 point pullback on the monthly chart, the daily chart might enter a brief bear trend.
Weekly S&P500 Emini futures candlestick chart:
weekly chart outside down bar sell signal
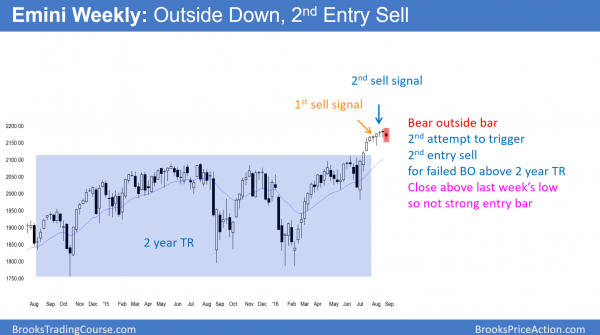
The weekly S&P500 Emini futures candlestick chart traded above last week’s high and then below last week’s low. Hence, this is an outside down week and a sign of strong bears.
Because the weekly Emini candlestick chart had 7 consecutive bull trend bars until 2 weeks ago, it formed a buy climax. When something unusual happens, it is unsustainable and therefore climactic. The odds therefore favor an end to the unusual behavior and a regression toward the mean. This simply means that the Emini would probably begin to have more typical price action. The most common price action is a trading range. As a result, the weekly chart will probably form a trading range over the next several weeks.
When the Emini forms a trading range, it probes down to find the bottom. While the bulls hope to maintain the gap above the 2100 top of the 2 year trading range, the odds are that they will fail. This is because a big breakout late in a trend is more likely to be an exhaustion gap than a measuring gap.
Trading range more likely than bear trend
Yet, even if the Emini falls back into the 2 year trading range, the momentum up over the past 2 months makes a big trading range more likely than a bear trend. A 100 point selloff would create a Big Up (in July and August), Big Down candlestick pattern. That is a reversal on some high time frame. For example, if I could create a 6 or 7 week candlestick chart, I would probably see a reversal bar. Yet, it confuses traders.
When traders are confused, they are confident that rallies and selloffs will not go very far. As a result, they buy selloffs and scale in lower. Furthermore, they sell rallies and scale in higher. Finally, they take quick profits because they believe the swings won’t last. The result is a trading range.
Daily S&P500 Emini futures candlestick chart:
Early bear trend reversal
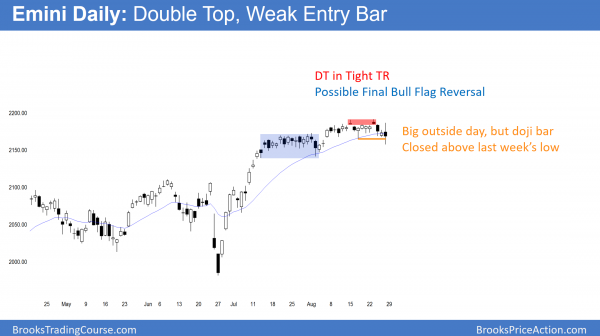
The daily S&P500 Emini futures candlestick chart had a strong rally in July. It then formed a tight trading range that lasted about a month. Hence, that was a possible Final Bull Flag. It then had a brief bull breakout in August, yet spent most of the month in another tight trading range. Because the context is good for a reversal (a Final Flag breakout just below resistance around 2200), the small double top of the past 2 weeks has special significance.
Double top in tight trading range
Most of the time, a double top in a tight trading range is meaningless. Because traders expect the range to continue, they scalp. Yet, when there is a reasonable top, a double top in the tight trading range has a 40% chance to lead to a big reversal. Usually the 1st leg down looks for for the bears. The bulls usually buy the selloff. The bulls are often able to create a bear channel that lasts 10 or more bars. Yet, the rally is a bear flag. If there then is another leg down, that leg is over surprisingly big and fast.
If there is a 40% chance that a 50 – 100 point swing down has begun, what happens during the other 60% fo the time? Most reversals fail. They usually lead to trading ranges. Yet, they sometimes quickly lead to trend resumption up. As a result, bears usually make a little or lose a little during this 60%, and they come out about breakeven. The reason they take the short is that the 40% that have swings down create big profits. That more than compensates them for all of the work required during the other 60% of trades.
Traders can see the end of the day bar-by-bar price action report by signing up for free at BrooksPriceAction.com. I talk about the detailed Emini price action real-time throughout the day in the BrooksPriceAction.com trading room. We offer a 2 day free trial.
When I mention time, it is USA Pacific Standard Time (the Emini day session opens at 6:30 am PST, and closes at 1:15 pm PST). You can read background information on the intraday market reports on the Intraday Market Update page.


