Monthly S&P500 Emini futures candlestick chart: Bull breakout of small pullback
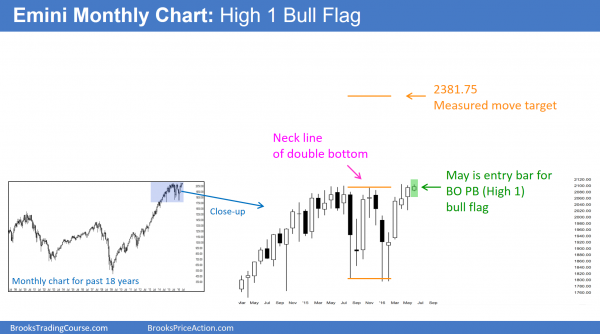
The monthly S&P500 Emini futures candlestick chart is breaking above a small bull flag at the top of a 2 year trading range.
The monthly S&P500 Emini futures candlestick chart had May as a buy signal bar on the because it was a pullback from April’s breakout to a new all-time high. The buy triggered when June went above the May high. However, it was also at the top of a 2 year trading range, and most trading range breakouts failed. There were more sellers than buyers, but Friday was only the 3rd day in the month, and the monthly candlestick pattern will be very different at the end of the month. The momentum up in February was strong. The past 4 months have had bull bodies. Buyers are still in control. If the month closes near its low, it might be a reasonable sell signal bar for a micro double top with the April high and a double top with the July 2015 former all-time high.
The bulls want June to be a big bull trend bar and a strong entry bar for the breakout above the May high and the all-time high. It is too early in the month to know if this will happen. The bull momentum is good, but the rally might simply be a buy vacuum test of the resistance at the top of the 2 year trading range.
Weekly S&P500 Emini futures candlestick chart: Weak follow-through buying at all-time high
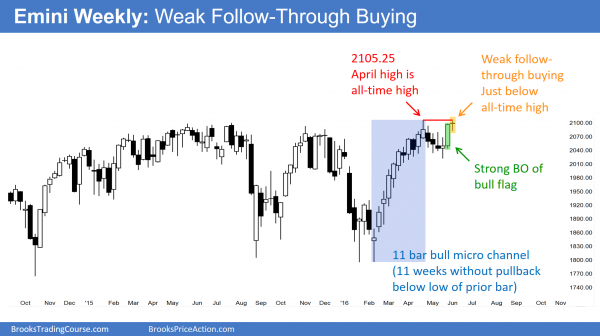
The weekly S&P500 Emini futures candlestick chart is stalled at the top of its trading range. The bulls see strong momentum up and the bears see a double top.
The weekly S&P500 Emini futures candlestick chart had an 11 week bull micro channel that began in February. There is usually a 1 – 3 bar pullback, then a test of the top of the channel, and then a trading range. Here, there was a 4 bar pullback, and this week tested the top of the channel. It pulled back some today, and this might be the start of a trading range, just below the all-time high. The momentum up has been so strong that it is probably likely that the Emini will make a new all-time high next week.
Also, even though the Emini is at its all-time high, the cash index high this week was still 23 points below the cash index high, which is a magnet. If the cash index gets drawn closer to its high, the Emini will get a breakout to a new all-time high. This increases the odds of a new all-time high in the Emini soon.
The weekly Emini had a strong rally 2 weeks ago. This past week was a bear doji. This is weak follow-through buying, but expected since the Emini has been in a trading range for 2 years. Whenever the bulls or bears try for a breakout, the odds are that the follow-though will disappoint them because that is what happens when traders believe the market is in a trading range. They are quick to take profits whenever there is strength, and the result is that the follow-through is usually disappointing.
Can the sell signal lead to a reversal down? It might, but unless there is a big bear trend bar or several consecutive small trend bars over the next few weeks, traders expect any attempt to reverse down to fail and then form a bull flag.
The bears see this past week as forming a double top with the April high. However, since it was a doji bar, it is a weak sell signal bar, especially following the strong bull trend bar of the week before. If next week falls below last week’s low, there will probably be more buyers than sellers there, despite the triggering of the sell signal. More likely, the weekly chart will go sideways for another week or two. The odds are that the momentum up in the 11 bar bull micro channel will result in more of an attempt at trend resumption up. The odds favor at least a small new all-time high within the next couple of weeks.
Daily S&P500 Emini futures candlestick chart: Learn how to day trade breakout mode price action
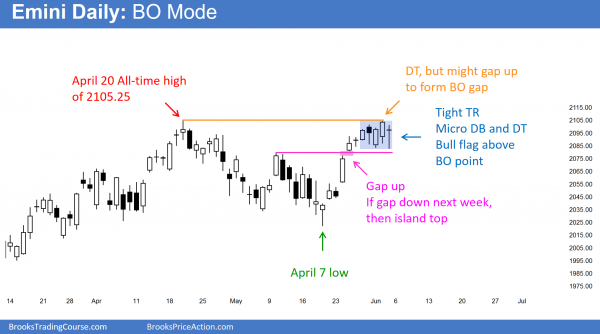
The daily S&P500 Emini futures candlestick chart is in a tight trading range at the all-time high after gapping up 2 weeks ago. Monday could gap up on the daily and weekly charts, or gap down and form an island top on the daily chart.
The daily S&P500 Emini futures candlestick chart had Friday fall below Thursday’s low. This triggered a 2nd entry sell signal for a failed breakout attempt of the 2 year trading range. The 1st sell signal came when Tuesday fell below the prior Friday’s low. Neither sell signal had a strong sell signal bar. The momentum up from the February low was very strong. The odds are that these 2 attempts to reverse down will be bought, and the Emini daily chart is instead forming a bull flag.
The May 24 bull breakout of its high 2 bull flag was strong enough to make a 2nd leg up likely. This is especially true since there was follow-through buying over the next several days. Since the Emini is at the top of its 2 year trading range, any follow-through buying will result in a new all-time high. The new high is likely to come within the next couple of weeks. However, the pullback might continue lower first, like to around a 50% retracement of the 3 week rally.
The Emini has been in a tight trading range for 7 days after gapping up on May 25. The top of the range is just 1 point below the all-time high. The tight trading range has a micro double top and a micro double bottom. It is in breakout mode.
While the breakout can simply come from a strong trend any day next week that begins within the tight trading range, it could also come from a gap. The Emini could gap up next week and this would create a gap up on the daily and weekly charts. The bulls would try to keep it open, hoping that it is a breakout gap and possibly a measuring gap. The nearest measured move would be based on the 75 point tall 2 month trading range. If the rally went beyond that, traders would look for a 300 point rally, based on the 2 year trading range.
If instead the Emini gapped down on Monday or any day next week and the gap stayed open, this would create an island top. The 1st target for the bears would be a measured move down based on the height of the 3 week island.
Whenever the Emini is in breakout mode, traders have to be prepared for the breakout failing and reversing or simply failing and continuing sideways. This happens about 50% of the time. Because of the location on the chart at the all-time high, and the very long 2 year trading range, the context is good for a big move. The Fed interest rate hike this summer or the Brexit could provide the fuel needed for the breakout. No one knows if there are more buyers or sells above or below. The news could start the process, and we would then find out. There is a potential for a swing up or down or in both directions after such protracted sideways trading.
Traders can see the end of the day bar-by-bar price action report by signing up for free at BrooksPriceAction.com. I talk about the detailed Emini price action real-time throughout the day in the BrooksPriceAction.com trading room, and a 2 day free trial is available.
When I mention time, it is USA Pacific Standard Time (the Emini day session opens at 6:30 am PST, and closes at 1:15 pm PST). You can read background information on the intraday market reports on the Intraday Market Update page.


