Monthly S&P500 Emini futures candlestick chart:
Stock market presidential election pullback
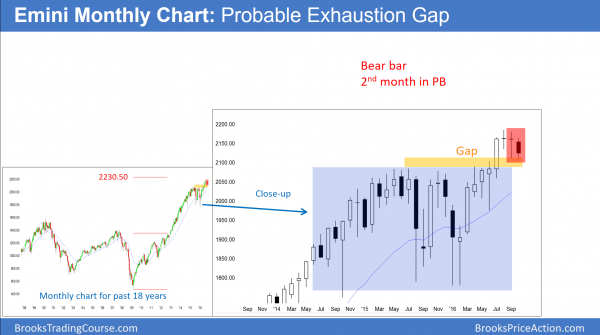
The monthly S&P500 Emini futures candlestick chart dipped below the September low. It is therefore the 2nd month of the pullback. Yet, it is a small bar following 2 dojis, and therefore neutral.
The monthly S&P500 Emini futures candlestick chart is in a bull trend. October closes on Monday, and the month will probably be the 3rd consecutive small bar after a breakout to a new all-time high. This is not how strong breakouts typically behave. It therefore increases the chances of lower prices. Furthermore, it has a bear body after 2 dojis. Hence, the bears are a little stronger. In addition, if November trades below October’s low, it would be the 3rd consecutive month with lower lows.
Most noteworthy is that these lows are still above the July 2015 high. There is therefore a gap. The bull trend has lasted more than 100 bars. Hence, the gap is late in the trend. Because it is late, it is more likely an Exhaustion Gap than a Measuring Gap. As a result, the odds are the it will close before the Emini rallies for a Measured move up.
The bull case is especially relevant because the monthly chart is still in a bull trend. While a rally to a new high probably will fail, there is a 40% chance that it would be the start of another strong leg up.
The next 3 years
The bond market is putting in a high for the next 20 years. While there still could be one more brief new high, there are nested wedge tops on the monthly chart. This is enough for traders to conclude that an reliable top is in.
The Emini has a Final Bull Flag on the monthly chart. Yet, there is no credible reversal down yet. The bulls might get one more push up and create a parabolic wedge top first. If the bears get their reversal, the first target is the bottom of the final flag. This is the 1800 bottom of the 2 year trading range.
The bulls will probably buy the bottom of the trading range. Yet, because the Final Flag is a major top, the odds are that the bears will sell the rally and create a lower high. At that point, there would be a Head and Shoulders top where the left shoulder is the 2015-2016 trading range. As a result, the monthly chart would be in Breakout Mode. The bulls would see a double bottom at 1800. The bears would see a Head and Shoulders top. If the bears then got their breakout, a 300 point measured move would test the monthly double top at around 1500.
Weekly S&P500 Emini futures candlestick chart:
Failed buy signal
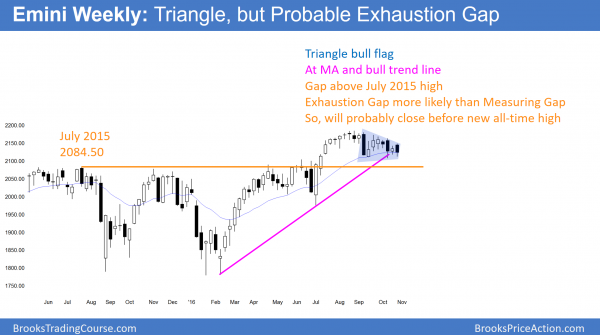
The weekly S&P500 Emini futures candlestick chart traded above last week’s high, triggering a buy signal. Yet, it reversed down strongly and traded below last week’s low. It was therefore an outside down bar.
The weekly S&P500 Emini futures candlestick chart traded up from a double bottom bull flag 2 weeks ago. But, the reversal up last week was weak. Furthermore, this week was a strong bear bar. While the 8 week trading range is still above the moving average, there have been several big bear bars. Because this week was an outside down week, it was a sign of strength for the bears.
Most noteworthy is the gap between the bottom of the double bottom and the July 2015 top of the 2 year trading range. This therefore is the same problem that the monthly chart has. The gap is too late in the bull trend. It is therefore more likely to close than to lead to a measured move up.
While the bulls realize that a new high could create a wedge top, they are still willing to buy unless the bears break below the 2 month double bottom. Their risk is small compared to their reward, and their probability is at least 40%. This means that the Trader’s Equation is still good for the bulls. As is always the case, when one side has good risk/reward, the other side has higher probability.
Daily S&P500 Emini futures candlestick chart:
Bear flag below the moving average
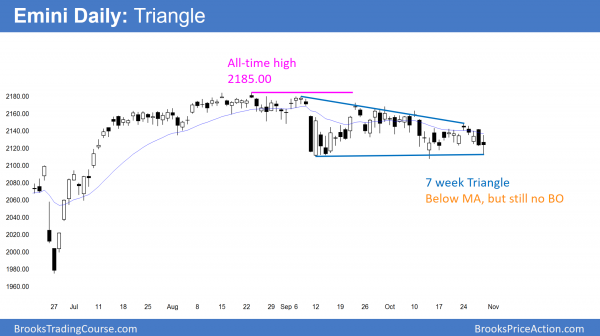
The daily S&P500 Emini futures candlestick chart continues to fail to get above the moving average. Yet, the bears have been unable to break strongly below the 7 week triangle or the 3 week tight trading range.
The daily S&P500 Emini futures candlestick chart broke below a bear flag this week. Most noteworthy is that the bear flag was below the moving average. This increases the chances of a measured move down. Yet, the Emini is still above the September-October double bottom low. If the bears break below the October low, the odds are that it would fall below the July 2015 high of 2084.50. In addition, it would probably test the July 6 pullback low. Buyers might not come back until 2040 – 2050.
I have written about this many times over the past 2 months. If there is a selloff, it could be very fast. Hence, it could fall 50 – 80 points in 2 – 5 days. Yet, it would still be a pullback on the monthly chart and bulls wold look to buy the selloff.
Traders can see the end of the day bar-by-bar price action report by signing up for free at BrooksPriceAction.com. I talk about the detailed Emini price action real-time throughout the day in the BrooksPriceAction.com trading room. We offer a 2 day free trial.
When I mention time, it is USA Pacific Standard Time (the Emini day session opens at 6:30 am PST, and closes at 1:15 pm PST). You can read background information on the intraday market reports on the Intraday Market Update page.


